Latest News
Red Rock Resorts Announces Fourth Quarter and Year End 2018 Results
 Reading Time: 7 minutes
Red Rock Resorts, Inc. reported financial results for the fourth quarter and year ended December 31, 2018. The Company adopted FASB’s new revenue recognition standard (“ASC 606”), effective January 1, 2018. Certain prior period amounts have been adjusted to reflect the full retrospective adoption of ASC 606, with no material impact on operating income, net income or Adjusted EBITDA(1).
Net revenues were $431.5 million for the fourth quarter of 2018, an increase of 7.8%, or $31.2 million, from $400.3 million for the same period of 2017. The increase in net revenues was primarily due to an increase in Las Vegas operations, partially offset by a decrease in Native American management fees due to the expiration of the Gun Lake management agreement in February of 2018.
Net income was $13.2 million for the fourth quarter of 2018, a decrease of 71.3%, or $32.8 million, from $46.0 million for the same period of 2017. The decrease in net income was primarily due to an after-tax decrease in the fair value of derivative instruments of $23.9 million. These results also reflect an out-of-period, one-time, non-cash adjustment related to a lease obligation regarding our corporate office building that increased interest expense by $9.3 million and decreased net income by $8.6 million.
Adjusted EBITDA was $135.1 million for the fourth quarter of 2018, an increase of 10.1%, or $12.4 million, from $122.7 million in the same period of 2017. The increase in Adjusted EBITDA was primarily due to an increase in Las Vegas operations, partially offset by a decrease in Native American management fees due to the Gun Lake expiration.
For the full year, net revenues were $1.68 billion in 2018, an increase of 2.4%, or $38.9 million, from $1.64 billion for the same period of 2017. The increase in net revenues was primarily due to a $69.6 million increase in Las Vegas operations, partially offset by a $31.0 million decrease in Native American operations due to the Gun Lake expiration.
For the full year, net income was $219.5 million in 2018, compared to $63.5 million for the same period of 2017. The increase in net income was primarily due to a gain associated with the extinguishment of tax receivable liabilities, as well as a prior year loss associated with the acquisition of the leases at Boulder Station and Texas Station.
For the full year, Adjusted EBITDA was $509.0 million in 2018, an increase of 2.4%, or $11.7 million, from $497.2 million in 2017, primarily due to a $23.7 million increase in Las Vegas operations, partially offset by a $15.1 million decrease in Native American operations due to the Gun Lake expiration.
Las Vegas Operations
Net revenues from Las Vegas operations were $409.5 million for the fourth quarter of 2018, an increase of 10.4%, or $38.5 million, from $371.0 million in the same period of 2017. Adjusted EBITDA from Las Vegas operations was $121.0 million for the fourth quarter of 2018, an increase of 14.4%, or $15.2 million, from $105.8 million in the same period of 2017.
Native American Management
Adjusted EBITDA from Native American operations was $19.1 million for the fourth quarter of 2018, a 22.1% decrease from $24.5 million in the same period of 2017. The decrease was primarily due to the Gun Lake expiration, partially offset by increased management fees generated under the Graton Resort management agreement.
Palace Station and Palms Redevelopment Update
The Palace Station redevelopment project was completed on schedule and on budget with all aspects of the project open as of the end of 2018. As of December 31, 2018, the Company has incurred $188 million in costs against the budget of $191 million.
The Palms redevelopment project remains on schedule and the budget remains unchanged with the remaining components of phase two expected to be complete in the second quarter of 2019 and phase three expected to be complete in the third quarter of 2019. As of December 31, 2018, the Company has incurred approximately $430 million in costs against the $690 million project.
Balance Sheet Highlights
The Company’s cash and cash equivalents at December 31, 2018 were $114.6 million and total principal amount of debt outstanding at the end of the fourth quarter was $2.91 billion. The Company’s debt to Adjusted EBITDA and interest coverage ratios were 5.0x and 4.4x, respectively.
Quarterly Dividend
The Company’s Board of Directors has declared a cash dividend of $0.10 per Class A common share for the first quarter of 2019. The dividend will be payable on March 29, 2019 to all stockholders of record as of the close of business on March 14, 2019.
Prior to the payment of such dividend, Station Holdco LLC (“Station Holdco”) will make a cash distribution to all unit holders of record, including the Company, of $0.10 per unit for a total distribution of approximately $11.7 million, approximately $7.0 million of which is expected to be distributed to the Company and approximately $4.7 million of which is expected to be distributed to the other unit holders of record of Station Holdco.
Conference Call Information
The Company will host a conference call today at 4:30 p.m. Eastern Time to discuss its financial results. The conference call will consist of prepared remarks from the Company and include a question and answer session. Those interested in participating in the call should dial (888) 317-6003, or (412) 317-6061 for international callers, approximately 15 minutes before the call start time. Please use the passcode: 4563756. A replay of the call will be available from today through February 20, 2019 at www.redrockresorts.com.
Presentation of Financial Information
(1) Adjusted EBITDA is a non-GAAP measure that is presented solely as a supplemental disclosure. We believe that Adjusted EBITDA is a widely used measure of operating performance in our industry and is a principal basis for valuation of gaming companies. We believe that in addition to net income, Adjusted EBITDA is a useful financial performance measurement for assessing our operating performance because it provides information about the performance of our ongoing core operations excluding non-cash expenses, financing costs, and other non-operational or non-recurring items. Adjusted EBITDA includes net income plus depreciation and amortization, share-based compensation, write-downs and other charges, net, tax receivable agreement liability adjustment, related party lease termination, asset impairment, interest expense, net, loss on extinguishment/modification of debt, net, change in fair value of derivative instruments, provision for income tax and other, and excludes Adjusted EBITDA attributable to the noncontrolling interests of MPM.
Company Information and Forward Looking Statements
Red Rock Resorts owns a majority indirect equity interest in and manages Station Casinos LLC (“Station Casinos”). Station Casinos is the leading provider of gaming and entertainment to the residents of Las Vegas, Nevada. Station Casinos’ properties, which are located throughout the Las Vegas valley, are regional entertainment destinations and include various amenities, including numerous restaurants, entertainment venues, movie theaters, bowling and convention/banquet space, as well as traditional casino gaming offerings such as video poker, slot machines, table games, bingo and race and sports wagering. Station Casinos owns and operates Red Rock Casino Resort Spa, Green Valley Ranch Resort Spa Casino, Palms Casino Resort, Palace Station Hotel & Casino, Boulder Station Hotel & Casino, Sunset Station Hotel & Casino, Santa Fe Station Hotel & Casino, Texas Station Gambling Hall & Hotel, Fiesta Rancho Casino Hotel, Fiesta Henderson Casino Hotel, Wildfire Rancho, Wildfire Boulder, Wild Wild West Gambling Hall & Hotel, Wildfire Sunset, Wildfire Valley View, Wildfire Anthem and Wildfire Lake Mead. Station Casinos also owns a 50% interest in Barley’s Casino & Brewing Company, Wildfire Casino & Lanes and The Greens. In addition, Station Casinos is the manager of Graton Resort & Casino in northern California.
This press release contains certain forward-looking statements with respect to the Company and its subsidiaries which involve risks and uncertainties that cannot be predicted or quantified, and consequently, actual results may differ materially from those expressed or implied herein. Such risks and uncertainties include, but are not limited to the effects of the economy and business conditions on consumer spending and our business; competition, including the risk that new gaming licenses or gaming activities are approved; our substantial outstanding indebtedness and the effect of our significant debt service requirements; our ability to refinance our outstanding indebtedness and obtain necessary capital; the impact of extensive regulation; risks associated with changes to applicable gaming and tax laws; risks associated with development, construction and management of new projects or the redevelopment or expansion of existing facilities; and other risks described in the filings of the Company with the Securities and Exchange Commission. In providing forward-looking statements, the Company is not undertaking any duty or obligation to update these statements publicly as a result of new information, future events or otherwise, except as required by law. If the Company updates one or more forward-looking statements, no inference should be drawn that it will make additional updates with respect to those other forward-looking statements.
|
Red Rock Resorts, Inc. |
|||||||
|
Consolidated Statements of Income |
|||||||
|
(amounts in thousands, except per share data) |
|||||||
|
(unaudited) |
|||||||
|
Three Months Ended |
Year Ended |
||||||
|
2018 |
2017 |
2018 |
2017 |
||||
|
Operating revenues: |
|||||||
|
Casino |
$ 240,757 |
$ 221,763 |
$ 940,483 |
$ 886,206 |
|||
|
Food and beverage |
100,971 |
87,995 |
381,197 |
365,448 |
|||
|
Room |
42,169 |
39,640 |
170,824 |
179,041 |
|||
|
Other |
27,054 |
22,940 |
100,912 |
92,967 |
|||
|
Management fees |
20,520 |
27,972 |
87,614 |
118,477 |
|||
|
Net revenues |
431,471 |
400,310 |
1,681,030 |
1,642,139 |
|||
|
Operating costs and expenses: |
|||||||
|
Casino |
84,854 |
79,388 |
326,980 |
311,086 |
|||
|
Food and beverage |
87,892 |
78,406 |
340,212 |
326,069 |
|||
|
Room |
19,314 |
19,297 |
78,440 |
81,768 |
|||
|
Other |
14,320 |
10,074 |
48,431 |
40,332 |
|||
|
Selling, general and administrative |
92,952 |
92,215 |
390,492 |
380,930 |
|||
|
Depreciation and amortization |
46,864 |
43,496 |
180,255 |
178,217 |
|||
|
Write-downs and other charges, net |
13,580 |
3,653 |
34,650 |
29,584 |
|||
|
Tax receivable agreement liability adjustment |
(263) |
(139,070) |
(90,638) |
(139,300) |
|||
|
Related party lease termination |
— |
— |
— |
100,343 |
|||
|
Asset impairment |
— |
— |
— |
1,829 |
|||
|
359,513 |
187,459 |
1,308,822 |
1,310,858 |
||||
|
Operating income |
71,958 |
212,851 |
372,208 |
331,281 |
|||
|
Earnings from joint ventures |
579 |
390 |
2,185 |
1,632 |
|||
|
Operating income and earnings from joint ventures |
72,537 |
213,241 |
374,393 |
332,913 |
|||
|
Other (expense) income: |
|||||||
|
Interest expense, net |
(46,800) |
(31,315) |
(143,099) |
(131,442) |
|||
|
Loss on extinguishment/modification of debt, net |
— |
(13,355) |
— |
(16,907) |
|||
|
Change in fair value of derivative instruments |
(14,938) |
11,053 |
12,415 |
14,112 |
|||
|
Other |
(67) |
(99) |
(354) |
(357) |
|||
|
(61,805) |
(33,716) |
(131,038) |
(134,594) |
||||
|
Income before income tax |
10,732 |
179,525 |
243,355 |
198,319 |
|||
|
Benefit (provision) for income tax |
2,449 |
(133,556) |
(23,875) |
(134,786) |
|||
|
Net income |
13,181 |
45,969 |
219,480 |
63,533 |
|||
|
Less: net income attributable to noncontrolling interests |
4,235 |
16,497 |
61,939 |
28,110 |
|||
|
Net income attributable to Red Rock Resorts, Inc. |
$ 8,946 |
$ 29,472 |
$ 157,541 |
$ 35,423 |
|||
|
Earnings per common share: |
|||||||
|
Earnings per share of Class A common stock, basic |
$ 0.13 |
$ 0.43 |
$ 2.28 |
$ 0.53 |
|||
|
Earnings per share of Class A common stock, diluted |
$ 0.11 |
$ 0.35 |
$ 1.77 |
$ 0.42 |
|||
|
Weighted-average common shares outstanding: |
|||||||
|
Basic |
69,283 |
68,486 |
69,115 |
67,397 |
|||
|
Diluted |
116,414 |
116,274 |
116,859 |
115,930 |
|||
|
Dividends declared per common share |
$ 0.10 |
$ 0.10 |
$ 0.40 |
$ 0.40 |
|||
|
Red Rock Resorts, Inc. |
|||||||
|
Segment Information and Reconciliation of Net Income to Adjusted EBITDA |
|||||||
|
(amounts in thousands) |
|||||||
|
(unaudited) |
|||||||
|
Three Months Ended |
Year Ended |
||||||
|
2018 |
2017 |
2018 |
2017 |
||||
|
Net revenues |
|||||||
|
Las Vegas operations |
$ 409,483 |
$ 370,985 |
$ 1,588,003 |
$ 1,518,442 |
|||
|
Native American management |
20,365 |
27,842 |
87,009 |
117,968 |
|||
|
Reportable segment net revenues |
429,848 |
398,827 |
1,675,012 |
1,636,410 |
|||
|
Corporate and other |
1,623 |
1,483 |
6,018 |
5,729 |
|||
|
Net revenues |
$ 431,471 |
$ 400,310 |
$ 1,681,030 |
$ 1,642,139 |
|||
|
Net income |
$ 13,181 |
$ 45,969 |
$ 219,480 |
$ 63,533 |
|||
|
Adjustments |
|||||||
|
Depreciation and amortization |
46,864 |
43,496 |
180,255 |
178,217 |
|||
|
Share-based compensation |
2,417 |
2,195 |
11,289 |
7,922 |
|||
|
Write-downs and other charges, net |
13,580 |
3,653 |
34,650 |
29,584 |
|||
|
Tax receivable agreement liability adjustment |
(263) |
(139,070) |
(90,638) |
(139,300) |
|||
|
Related party lease termination |
— |
— |
— |
100,343 |
|||
|
Asset impairment |
— |
— |
— |
1,829 |
|||
|
Interest expense, net |
46,800 |
31,315 |
143,099 |
131,442 |
|||
|
Loss on extinguishment/modification of debt, net |
— |
13,355 |
— |
16,907 |
|||
|
Change in fair value of derivative instruments |
14,938 |
(11,053) |
(12,415) |
(14,112) |
|||
|
Adjusted EBITDA attributable to MPM noncontrolling interest |
— |
(1,780) |
(962) |
(15,262) |
|||
|
(Benefit) provision for income tax |
(2,449) |
133,556 |
23,875 |
134,786 |
|||
|
Other |
67 |
1,099 |
329 |
1,357 |
|||
|
Adjusted EBITDA |
$ 135,135 |
$ 122,735 |
$ 508,962 |
$ 497,246 |
|||
|
Adjusted EBITDA |
|||||||
|
Las Vegas operations |
$ 120,971 |
$ 105,790 |
$ 457,379 |
$ 433,640 |
|||
|
Native American management |
19,124 |
24,548 |
80,795 |
95,897 |
|||
|
Reportable segment Adjusted EBITDA |
140,095 |
130,338 |
538,174 |
529,537 |
|||
|
Corporate and other |
(4,960) |
(7,603) |
(29,212) |
(32,291) |
|||
|
Adjusted EBITDA |
$ 135,135 |
$ 122,735 |
$ 508,962 |
$ 497,246 |
|||
Source: Red Rock Resorts, Inc.
Source: Latest News on European Gaming Media Network
This is a Syndicated News piece. Photo credits or photo sources can be found on the source article: Red Rock Resorts Announces Fourth Quarter and Year End 2018 Results

Latest News
Meridian Donate: Revolutionizing CSR in the Betting and Gaming Industry
- Innovative engagement strategy positions MeridianBet as a leader in CSR within the betting and gaming industry
- Optimized brand loyalty as active customer participation in CSR strengthens connection and loyalty
- Scalable impact, as the model is designed for expansion and could be adapted to new markets, indicating potential for widespread adoption and growth
Transforming Customers into Environmentalists and Humanitarians
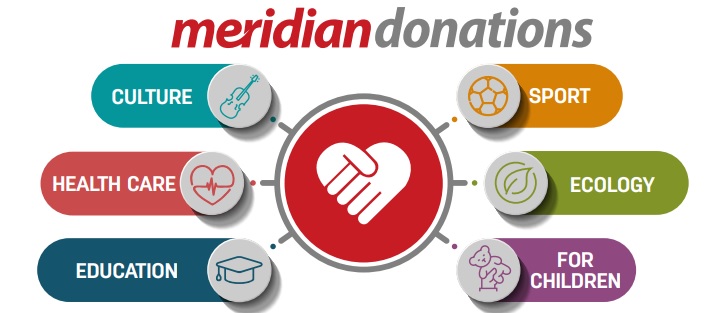
MeridianBet’s pioneering initiative, Meridian Donate, is transforming the betting industry by engaging customers directly in corporate social responsibility (CSR) actions. This unique platform allows customers to actively participate in and fund various environmental, societal and humanitarian projects, setting a new standard for customer engagement and community impact.
Key Features of Meridian Donate:
- Direct customer involvement: Customers are not just donors but active participants in CSR decisions
- Diverse programs: Offers choices from global afforestation to local humanitarian efforts
- Partnerships with renowned organizations: Collaborates with entities like the Red Cross and UNICEF
Expanding Impact: A Year-by-Year Growth
The Meridian Donate platform has seen substantial growth in its scope and impact:
- Number of individual campaigns: Grew from 8 in 2021 to 20 in 2023
- National markets Integrated: Expanded from 3 in 2021 to 8 in 2023
- Direct Beneficiaries: Increased from 43 NGOs in 2021 to 159 in 2023
In 2023 alone, the platform’s expansion into eight markets facilitated 20 customer-funded campaigns, directly benefiting 159 NGOs, up from 122 the previous year.
Continued Commitment to Innovation and Community Involvement
Meridian Donate not only showcases MeridianBet’s dedication to CSR but also redefines the role of digital marketing within the industry. By converting sports bettors into active CSR participants, Meridian Donate enhances customer loyalty and brand value, making it a critical element of MeridianBet’s market strategy.
Recent Successes and Future Outlook
In its recent operation, Meridian Donate has launched an ambitious global afforestation initiative, committing to plant 20,000 seedlings across various regions. This project not only underscores our environmental commitment but also enhances our brand’s community presence. Already, several hundred contributions have been recorded in the platform’s first month, indicating robust customer engagement and support.
The post Meridian Donate: Revolutionizing CSR in the Betting and Gaming Industry appeared first on European Gaming Industry News.
Latest News
Imagine Live Launches Casino Hold’em
Imagine Live proudly unveils its latest game addition – Casino Hold’em. This thrilling new game promises to elevate the poker experience for enthusiasts and novices alike, combining the excitement of traditional Texas Hold’em with the thrill of live casino action.
Casino Hold’em offers players a dynamic and immersive gaming experience. With sleek graphics, intuitive gameplay, and live dealers, players will feel seated at a high-stakes table in a world-class casino right from the comfort of their homes.
Key features of Casino Hold’em include:
Neon-lighting Studio: Casino Hold’em has a very inviting atmosphere. It features an elegant, well-designed studio with neon lighting that evokes a sophisticated gaming environment.
Captivating Gameplay: Stunning graphics and seamless gameplay transport players to the heart of the action.
Bonus Bet: In Casino Hold’em, players can place a Bonus bet alongside their initial Ante bet. Even if the Play bet is lost, the Bonus bet remains unaffected and can still be won if the specific hand criteria are met.
Multiplatform Compatibility: Enjoy Casino Hold’em on desktop, tablet, or mobile devices, allowing players to play anytime, anywhere.
“We’re thrilled to introduce Casino Hold’em to our players,” said Mikayel Aznauryan, Chief Product Officer at Imagine Live. “At Imagine Live, we’re committed to delivering premium gaming experiences, and Casino Hold’em is no exception. With its blend of live action, strategic gameplay, and neon design, we believe it will quickly become a favorite among poker enthusiasts worldwide.”
The post Imagine Live Launches Casino Hold’em appeared first on European Gaming Industry News.
Latest News
Relax Gaming increases Italian presence via Octavian Lab aggregation deal
Relax Gaming, the iGaming aggregator and supplier of unique content, has further increased its footprint in the Italian market with Octavian Lab.
Octavian Lab is a software house and service provider for online gaming suppliers. Led by highly specialised technicians, the company is committed to the development of products, protocols and integrated solutions in key regulated iGaming markets.
This partnership will see Octavian Lab’s operator partners in Italy, including leading sportsbook and casino Eurobet, gain access to a host of popular Relax Gaming titles.
Eurobet players are now able to enjoy timeless classics from Relax Gaming including the hugely popular Money Train series, Wild Chapo 2 and Marching Legions.
Gianluca Crimaldi, Director of Italy at Relax Gaming, said: “In order to continue our hugely successful trajectory in key markets such as Italy it is imperative that we continue working alongside some of the industry’s best aggregators.
“We are delighted to partner with the talented team at Octavian Lab who are helping ensure our games reach Italian players via the country’s top operators.”
Emanuele Nocentelli, CEO of Octavian Lab added: “We are proud of our partnership with Relax Gaming, one of the industry’s leading providers of high-quality games. It’s fantastic to be distributing their portfolio via our Gaming and Aggregation platforms and we are confident that Relax content will resonate with a wide audience of players across Italy. We look forward to maintaining and building upon this partnership for a long time to come.”
The post Relax Gaming increases Italian presence via Octavian Lab aggregation deal appeared first on European Gaming Industry News.
-

 Latest News2 months ago
Fairplay Exchange signs as new sponsor of Stephen Hendry’s Cue Tips
-

 Latest News3 months ago
2 PEOPLE CAUGHT OPERATING ILLEGAL ONLINE GAMING SITE
-

 Latest News3 months ago
Wazdan partners with 711.nl for significant expansion in the Netherlands
-

 Latest News3 months ago
Playtech Extends Partnership with BoyleSports Until 2028
-

 Latest News3 months ago
StarGames Named Premium Partner of the International ADAC Truck Grand Prix 2024
-

 Latest News3 months ago
Senet Platform Partners with Beamable
-

 Latest News3 months ago
Tekkorp and Circle Squared
-

 Latest News2 months ago
European Gaming Q1 2024 Meetup: Exploring Innovation, Marketing, and the iGaming Industry Hubs



















You must be logged in to post a comment Login