Latest News
Global Gambling Machines Market to Reach $107 Billion by 2030
Reportlinker .com announces the release of the report “Global Gambling Machines Industry”
Food and fuel inflation will remain a persistent economic problem. Higher retail inflation will impact consumer confidence and spending. As governments combat inflation by raising interest rates, new job creation will slowdown and impact economic activity and growth. Lower capital expenditure is in the offing as companies go slow on investments, held back by inflation worries and weaker demand. With slower growth and high inflation, developed markets seem primed to enter into a recession. Fears of new COVID outbreaks and China’s already uncertain post-pandemic path poses a real risk of the world experiencing more acute supply chain pain and manufacturing disruptions this year. Volatile financial markets, growing trade tensions, stricter regulatory environment and pressure to mainstream climate change into economic decisions will compound the complexity of challenges faced. Year 2023 is expected to be tough year for most markets, investors and consumers. Nevertheless, there is always opportunity for businesses and their leaders who can chart a path forward with resilience and adaptability.
Global Gambling Machines Market to Reach $107 Billion by 2030
In the changed post COVID-19 business landscape, the global market for Gambling Machines estimated at US$62.1 Billion in the year 2022, is projected to reach a revised size of US$107 Billion by 2030, growing at aCAGR of 7% over the period 2022-2030. Online, one of the segments analyzed in the report, is projected to record 6.8% CAGR and reach US$67.6 Billion by the end of the analysis period. Taking into account the ongoing post pandemic recovery, growth in the Offline segment is readjusted to a revised 7.4% CAGR for the next 8-year period.
The U.S. Market is Estimated at $16.9 Billion, While China is Forecast to Grow at 11% CAGR
The Gambling Machines market in the U.S. is estimated at US$16.9 Billion in the year 2022. China, the world`s second largest economy, is forecast to reach a projected market size of US$24 Billion by the year 2030 trailing a CAGR of 11% over the analysis period 2022 to 2030. Among the other noteworthy geographic markets are Japan and Canada, each forecast to grow at 4.2% and 5.6% respectively over the 2022-2030 period. Within Europe, Germany is forecast to grow at approximately 5.1% CAGR.
Select Competitors (Total 36 Featured)
– Ainsworth Game Technology
– Aristocrat Leisure
– ASTRO Gaming
– Everi Holdings
– Galaxy Entertainment Group
– Gaming Partners International
– IGT
– Konami Gaming
– NOVOMATIC Group
– Scientific Games
– Universal Entertainment
Read the full report: https://www.reportlinker .com/p06031660/?utm_source=GNW
I. METHODOLOGY
II. EXECUTIVE SUMMARY
1. MARKET OVERVIEW
Influencer Market Insights
World Market Trajectories
Impact of Covid-19 and a Looming Global Recession
Gambling Machines – Global Key Competitors Percentage Market
Share in 2022 (E)
Competitive Market Presence – Strong/Active/Niche/Trivial for
Players Worldwide in 2022 (E)
2. FOCUS ON SELECT PLAYERS
3. MARKET TRENDS & DRIVERS
4. GLOBAL MARKET PERSPECTIVE
Table 1: World Recent Past, Current & Future Analysis for
Gambling Machines by Geographic Region – USA, Canada, Japan,
China, Europe, Asia-Pacific, Latin America, Middle East and
Africa Markets – Independent Analysis of Annual Sales in US$
Million for Years 2022 through 2030 and % CAGR
Table 2: World Historic Review for Gambling Machines by
Geographic Region – USA, Canada, Japan, China, Europe,
Asia-Pacific, Latin America, Middle East and Africa Markets –
Independent Analysis of Annual Sales in US$ Million for Years
2014 through 2021 and % CAGR
Table 3: World 16-Year Perspective for Gambling Machines by
Geographic Region – Percentage Breakdown of Value Sales for
USA, Canada, Japan, China, Europe, Asia-Pacific, Latin America,
Middle East and Africa Markets for Years 2014, 2023 & 2030
Table 4: World Recent Past, Current & Future Analysis for
Online by Geographic Region – USA, Canada, Japan, China,
Europe, Asia-Pacific, Latin America, Middle East and Africa
Markets – Independent Analysis of Annual Sales in US$ Million
for Years 2022 through 2030 and % CAGR
Table 5: World Historic Review for Online by Geographic Region –
USA, Canada, Japan, China, Europe, Asia-Pacific, Latin
America, Middle East and Africa Markets – Independent Analysis
of Annual Sales in US$ Million for Years 2014 through 2021 and
% CAGR
Table 6: World 16-Year Perspective for Online by Geographic
Region – Percentage Breakdown of Value Sales for USA, Canada,
Japan, China, Europe, Asia-Pacific, Latin America, Middle East
and Africa for Years 2014, 2023 & 2030
Table 7: World Recent Past, Current & Future Analysis for
Offline by Geographic Region – USA, Canada, Japan, China,
Europe, Asia-Pacific, Latin America, Middle East and Africa
Markets – Independent Analysis of Annual Sales in US$ Million
for Years 2022 through 2030 and % CAGR
Table 8: World Historic Review for Offline by Geographic Region –
USA, Canada, Japan, China, Europe, Asia-Pacific, Latin
America, Middle East and Africa Markets – Independent Analysis
of Annual Sales in US$ Million for Years 2014 through 2021 and
% CAGR
Table 9: World 16-Year Perspective for Offline by Geographic
Region – Percentage Breakdown of Value Sales for USA, Canada,
Japan, China, Europe, Asia-Pacific, Latin America, Middle East
and Africa for Years 2014, 2023 & 2030
Table 10: World Gambling Machines Market Analysis of Annual
Sales in US$ Million for Years 2014 through 2030
III. MARKET ANALYSIS
UNITED STATES
Gambling Machines Market Presence – Strong/Active/Niche/Trivial –
Key Competitors in the United States for 2023 (E)
Table 11: USA Recent Past, Current & Future Analysis for
Gambling Machines by Application – Online and Offline –
Independent Analysis of Annual Sales in US$ Million for the
Years 2022 through 2030 and % CAGR
Table 12: USA Historic Review for Gambling Machines by
Application – Online and Offline Markets – Independent Analysis
of Annual Sales in US$ Million for Years 2014 through 2021 and
% CAGR
Table 13: USA 16-Year Perspective for Gambling Machines by
Application – Percentage Breakdown of Value Sales for Online
and Offline for the Years 2014, 2023 & 2030
CANADA
Table 14: Canada Recent Past, Current & Future Analysis for
Gambling Machines by Application – Online and Offline –
Independent Analysis of Annual Sales in US$ Million for the
Years 2022 through 2030 and % CAGR
Table 15: Canada Historic Review for Gambling Machines by
Application – Online and Offline Markets – Independent Analysis
of Annual Sales in US$ Million for Years 2014 through 2021 and
% CAGR
Table 16: Canada 16-Year Perspective for Gambling Machines by
Application – Percentage Breakdown of Value Sales for Online
and Offline for the Years 2014, 2023 & 2030
JAPAN
Gambling Machines Market Presence – Strong/Active/Niche/Trivial –
Key Competitors in Japan for 2023 (E)
Table 17: Japan Recent Past, Current & Future Analysis for
Gambling Machines by Application – Online and Offline –
Independent Analysis of Annual Sales in US$ Million for the
Years 2022 through 2030 and % CAGR
Table 18: Japan Historic Review for Gambling Machines by
Application – Online and Offline Markets – Independent Analysis
of Annual Sales in US$ Million for Years 2014 through 2021 and
% CAGR
Table 19: Japan 16-Year Perspective for Gambling Machines by
Application – Percentage Breakdown of Value Sales for Online
and Offline for the Years 2014, 2023 & 2030
CHINA
Gambling Machines Market Presence – Strong/Active/Niche/Trivial –
Key Competitors in China for 2023 (E)
Table 20: China Recent Past, Current & Future Analysis for
Gambling Machines by Application – Online and Offline –
Independent Analysis of Annual Sales in US$ Million for the
Years 2022 through 2030 and % CAGR
Table 21: China Historic Review for Gambling Machines by
Application – Online and Offline Markets – Independent Analysis
of Annual Sales in US$ Million for Years 2014 through 2021 and
% CAGR
Table 22: China 16-Year Perspective for Gambling Machines by
Application – Percentage Breakdown of Value Sales for Online
and Offline for the Years 2014, 2023 & 2030
EUROPE
Gambling Machines Market Presence – Strong/Active/Niche/Trivial –
Key Competitors in Europe for 2023 (E)
Table 23: Europe Recent Past, Current & Future Analysis for
Gambling Machines by Geographic Region – France, Germany,
Italy, UK, Spain, Russia and Rest of Europe Markets –
Independent Analysis of Annual Sales in US$ Million for Years
2022 through 2030 and % CAGR
Table 24: Europe Historic Review for Gambling Machines by
Geographic Region – France, Germany, Italy, UK, Spain, Russia
and Rest of Europe Markets – Independent Analysis of Annual
Sales in US$ Million for Years 2014 through 2021 and % CAGR
Table 25: Europe 16-Year Perspective for Gambling Machines by
Geographic Region – Percentage Breakdown of Value Sales for
France, Germany, Italy, UK, Spain, Russia and Rest of Europe
Markets for Years 2014, 2023 & 2030
Table 26: Europe Recent Past, Current & Future Analysis for
Gambling Machines by Application – Online and Offline –
Independent Analysis of Annual Sales in US$ Million for the
Years 2022 through 2030 and % CAGR
Table 27: Europe Historic Review for Gambling Machines by
Application – Online and Offline Markets – Independent Analysis
of Annual Sales in US$ Million for Years 2014 through 2021 and
% CAGR
Table 28: Europe 16-Year Perspective for Gambling Machines by
Application – Percentage Breakdown of Value Sales for Online
and Offline for the Years 2014, 2023 & 2030
FRANCE
Gambling Machines Market Presence – Strong/Active/Niche/Trivial –
Key Competitors in France for 2023 (E)
Table 29: France Recent Past, Current & Future Analysis for
Gambling Machines by Application – Online and Offline –
Independent Analysis of Annual Sales in US$ Million for the
Years 2022 through 2030 and % CAGR
Table 30: France Historic Review for Gambling Machines by
Application – Online and Offline Markets – Independent Analysis
of Annual Sales in US$ Million for Years 2014 through 2021 and
% CAGR
Table 31: France 16-Year Perspective for Gambling Machines by
Application – Percentage Breakdown of Value Sales for Online
and Offline for the Years 2014, 2023 & 2030
GERMANY
Gambling Machines Market Presence – Strong/Active/Niche/Trivial –
Key Competitors in Germany for 2023 (E)
Table 32: Germany Recent Past, Current & Future Analysis for
Gambling Machines by Application – Online and Offline –
Independent Analysis of Annual Sales in US$ Million for the
Years 2022 through 2030 and % CAGR
Table 33: Germany Historic Review for Gambling Machines by
Application – Online and Offline Markets – Independent Analysis
of Annual Sales in US$ Million for Years 2014 through 2021 and
% CAGR
Table 34: Germany 16-Year Perspective for Gambling Machines by
Application – Percentage Breakdown of Value Sales for Online
and Offline for the Years 2014, 2023 & 2030
ITALY
Table 35: Italy Recent Past, Current & Future Analysis for
Gambling Machines by Application – Online and Offline –
Independent Analysis of Annual Sales in US$ Million for the
Years 2022 through 2030 and % CAGR
Table 36: Italy Historic Review for Gambling Machines by
Application – Online and Offline Markets – Independent Analysis
of Annual Sales in US$ Million for Years 2014 through 2021 and
% CAGR
Table 37: Italy 16-Year Perspective for Gambling Machines by
Application – Percentage Breakdown of Value Sales for Online
and Offline for the Years 2014, 2023 & 2030
UNITED KINGDOM
Gambling Machines Market Presence – Strong/Active/Niche/Trivial –
Key Competitors in the United Kingdom for 2023 (E)
Table 38: UK Recent Past, Current & Future Analysis for
Gambling Machines by Application – Online and Offline –
Independent Analysis of Annual Sales in US$ Million for the
Years 2022 through 2030 and % CAGR
Table 39: UK Historic Review for Gambling Machines by
Application – Online and Offline Markets – Independent Analysis
of Annual Sales in US$ Million for Years 2014 through 2021 and
% CAGR
Table 40: UK 16-Year Perspective for Gambling Machines by
Application – Percentage Breakdown of Value Sales for Online
and Offline for the Years 2014, 2023 & 2030
SPAIN
Table 41: Spain Recent Past, Current & Future Analysis for
Gambling Machines by Application – Online and Offline –
Independent Analysis of Annual Sales in US$ Million for the
Years 2022 through 2030 and % CAGR
Table 42: Spain Historic Review for Gambling Machines by
Application – Online and Offline Markets – Independent Analysis
of Annual Sales in US$ Million for Years 2014 through 2021 and
% CAGR
Table 43: Spain 16-Year Perspective for Gambling Machines by
Application – Percentage Breakdown of Value Sales for Online
and Offline for the Years 2014, 2023 & 2030
RUSSIA
Table 44: Russia Recent Past, Current & Future Analysis for
Gambling Machines by Application – Online and Offline –
Independent Analysis of Annual Sales in US$ Million for the
Years 2022 through 2030 and % CAGR
Table 45: Russia Historic Review for Gambling Machines by
Application – Online and Offline Markets – Independent Analysis
of Annual Sales in US$ Million for Years 2014 through 2021 and
% CAGR
Table 46: Russia 16-Year Perspective for Gambling Machines by
Application – Percentage Breakdown of Value Sales for Online
and Offline for the Years 2014, 2023 & 2030
REST OF EUROPE
Table 47: Rest of Europe Recent Past, Current & Future Analysis
for Gambling Machines by Application – Online and Offline –
Independent Analysis of Annual Sales in US$ Million for the
Years 2022 through 2030 and % CAGR
Table 48: Rest of Europe Historic Review for Gambling Machines
by Application – Online and Offline Markets – Independent
Analysis of Annual Sales in US$ Million for Years 2014 through
2021 and % CAGR
Table 49: Rest of Europe 16-Year Perspective for Gambling
Machines by Application – Percentage Breakdown of Value Sales
for Online and Offline for the Years 2014, 2023 & 2030
ASIA-PACIFIC
Gambling Machines Market Presence – Strong/Active/Niche/Trivial –
Key Competitors in Asia-Pacific for 2023 (E)
Table 50: Asia-Pacific Recent Past, Current & Future Analysis
for Gambling Machines by Geographic Region – Australia, India,
South Korea and Rest of Asia-Pacific Markets – Independent
Analysis of Annual Sales in US$ Million for Years 2022 through
2030 and % CAGR
Table 51: Asia-Pacific Historic Review for Gambling Machines by
Geographic Region – Australia, India, South Korea and Rest of
Asia-Pacific Markets – Independent Analysis of Annual Sales in
US$ Million for Years 2014 through 2021 and % CAGR
Table 52: Asia-Pacific 16-Year Perspective for Gambling
Machines by Geographic Region – Percentage Breakdown of Value
Sales for Australia, India, South Korea and Rest of
Asia-Pacific Markets for Years 2014, 2023 & 2030
Table 53: Asia-Pacific Recent Past, Current & Future Analysis
for Gambling Machines by Application – Online and Offline –
Independent Analysis of Annual Sales in US$ Million for the
Years 2022 through 2030 and % CAGR
Table 54: Asia-Pacific Historic Review for Gambling Machines by
Application – Online and Offline Markets – Independent Analysis
of Annual Sales in US$ Million for Years 2014 through 2021 and
% CAGR
Table 55: Asia-Pacific 16-Year Perspective for Gambling
Machines by Application – Percentage Breakdown of Value Sales
for Online and Offline for the Years 2014, 2023 & 2030
AUSTRALIA
Gambling Machines Market Presence – Strong/Active/Niche/Trivial –
Key Competitors in Australia for 2023 (E)
Table 56: Australia Recent Past, Current & Future Analysis for
Gambling Machines by Application – Online and Offline –
Independent Analysis of Annual Sales in US$ Million for the
Years 2022 through 2030 and % CAGR
Table 57: Australia Historic Review for Gambling Machines by
Application – Online and Offline Markets – Independent Analysis
of Annual Sales in US$ Million for Years 2014 through 2021 and
% CAGR
Table 58: Australia 16-Year Perspective for Gambling Machines
by Application – Percentage Breakdown of Value Sales for Online
and Offline for the Years 2014, 2023 & 2030
INDIA
Gambling Machines Market Presence – Strong/Active/Niche/Trivial –
Key Competitors in India for 2023 (E)
Table 59: India Recent Past, Current & Future Analysis for
Gambling Machines by Application – Online and Offline –
Independent Analysis of Annual Sales in US$ Million for the
Years 2022 through 2030 and % CAGR
Table 60: India Historic Review for Gambling Machines by
Application – Online and Offline Markets – Independent Analysis
of Annual Sales in US$ Million for Years 2014 through 2021 and
% CAGR
Table 61: India 16-Year Perspective for Gambling Machines by
Application – Percentage Breakdown of Value Sales for Online
and Offline for the Years 2014, 2023 & 2030
SOUTH KOREA
Table 62: South Korea Recent Past, Current & Future Analysis
for Gambling Machines by Application – Online and Offline –
Independent Analysis of Annual Sales in US$ Million for the
Years 2022 through 2030 and % CAGR
Table 63: South Korea Historic Review for Gambling Machines by
Application – Online and Offline Markets – Independent Analysis
of Annual Sales in US$ Million for Years 2014 through 2021 and
% CAGR
Table 64: South Korea 16-Year Perspective for Gambling Machines
by Application – Percentage Breakdown of Value Sales for Online
and Offline for the Years 2014, 2023 & 2030
REST OF ASIA-PACIFIC
Table 65: Rest of Asia-Pacific Recent Past, Current & Future
Analysis for Gambling Machines by Application – Online and
Offline – Independent Analysis of Annual Sales in US$ Million
for the Years 2022 through 2030 and % CAGR
Table 66: Rest of Asia-Pacific Historic Review for Gambling
Machines by Application – Online and Offline Markets –
Independent Analysis of Annual Sales in US$ Million for Years
2014 through 2021 and % CAGR
Table 67: Rest of Asia-Pacific 16-Year Perspective for Gambling
Machines by Application – Percentage Breakdown of Value Sales
for Online and Offline for the Years 2014, 2023 & 2030
LATIN AMERICA
Gambling Machines Market Presence – Strong/Active/Niche/Trivial –
Key Competitors in Latin America for 2023 (E)
Table 68: Latin America Recent Past, Current & Future Analysis
for Gambling Machines by Geographic Region – Argentina, Brazil,
Mexico and Rest of Latin America Markets – Independent Analysis
of Annual Sales in US$ Million for Years 2022 through 2030 and
% CAGR
Table 69: Latin America Historic Review for Gambling Machines
by Geographic Region – Argentina, Brazil, Mexico and Rest of
Latin America Markets – Independent Analysis of Annual Sales in
US$ Million for Years 2014 through 2021 and % CAGR
Table 70: Latin America 16-Year Perspective for Gambling
Machines by Geographic Region – Percentage Breakdown of Value
Sales for Argentina, Brazil, Mexico and Rest of Latin America
Markets for Years 2014, 2023 & 2030
Table 71: Latin America Recent Past, Current & Future Analysis
for Gambling Machines by Application – Online and Offline –
Independent Analysis of Annual Sales in US$ Million for the
Years 2022 through 2030 and % CAGR
Table 72: Latin America Historic Review for Gambling Machines
by Application – Online and Offline Markets – Independent
Analysis of Annual Sales in US$ Million for Years 2014 through
2021 and % CAGR
Table 73: Latin America 16-Year Perspective for Gambling
Machines by Application – Percentage Breakdown of Value Sales
for Online and Offline for the Years 2014, 2023 & 2030
ARGENTINA
Table 74: Argentina Recent Past, Current & Future Analysis for
Gambling Machines by Application – Online and Offline –
Independent Analysis of Annual Sales in US$ Million for the
Years 2022 through 2030 and % CAGR
Table 75: Argentina Historic Review for Gambling Machines by
Application – Online and Offline Markets – Independent Analysis
of Annual Sales in US$ Million for Years 2014 through 2021 and
% CAGR
Table 76: Argentina 16-Year Perspective for Gambling Machines
by Application – Percentage Breakdown of Value Sales for Online
and Offline for the Years 2014, 2023 & 2030
BRAZIL
Table 77: Brazil Recent Past, Current & Future Analysis for
Gambling Machines by Application – Online and Offline –
Independent Analysis of Annual Sales in US$ Million for the
Years 2022 through 2030 and % CAGR
Table 78: Brazil Historic Review for Gambling Machines by
Application – Online and Offline Markets – Independent Analysis
of Annual Sales in US$ Million for Years 2014 through 2021 and
% CAGR
Table 79: Brazil 16-Year Perspective for Gambling Machines by
Application – Percentage Breakdown of Value Sales for Online
and Offline for the Years 2014, 2023 & 2030
MEXICO
Table 80: Mexico Recent Past, Current & Future Analysis for
Gambling Machines by Application – Online and Offline –
Independent Analysis of Annual Sales in US$ Million for the
Years 2022 through 2030 and % CAGR
Table 81: Mexico Historic Review for Gambling Machines by
Application – Online and Offline Markets – Independent Analysis
of Annual Sales in US$ Million for Years 2014 through 2021 and
% CAGR
Table 82: Mexico 16-Year Perspective for Gambling Machines by
Application – Percentage Breakdown of Value Sales for Online
and Offline for the Years 2014, 2023 & 2030
REST OF LATIN AMERICA
Table 83: Rest of Latin America Recent Past, Current & Future
Analysis for Gambling Machines by Application – Online and
Offline – Independent Analysis of Annual Sales in US$ Million
for the Years 2022 through 2030 and % CAGR
Table 84: Rest of Latin America Historic Review for Gambling
Machines by Application – Online and Offline Markets –
Independent Analysis of Annual Sales in US$ Million for Years
2014 through 2021 and % CAGR
Table 85: Rest of Latin America 16-Year Perspective for
Gambling Machines by Application – Percentage Breakdown of
Value Sales for Online and Offline for the Years 2014, 2023 &
2030
MIDDLE EAST
Gambling Machines Market Presence – Strong/Active/Niche/Trivial –
Key Competitors in Middle East for 2023 (E)
Table 86: Middle East Recent Past, Current & Future Analysis
for Gambling Machines by Geographic Region – Iran, Israel,
Saudi Arabia, UAE and Rest of Middle East Markets – Independent
Analysis of Annual Sales in US$ Million for Years 2022 through
2030 and % CAGR
Table 87: Middle East Historic Review for Gambling Machines by
Geographic Region – Iran, Israel, Saudi Arabia, UAE and Rest of
Middle East Markets – Independent Analysis of Annual Sales in
US$ Million for Years 2014 through 2021 and % CAGR
Table 88: Middle East 16-Year Perspective for Gambling Machines
by Geographic Region – Percentage Breakdown of Value Sales for
Iran, Israel, Saudi Arabia, UAE and Rest of Middle East Markets
for Years 2014, 2023 & 2030
Table 89: Middle East Recent Past, Current & Future Analysis
for Gambling Machines by Application – Online and Offline –
Independent Analysis of Annual Sales in US$ Million for the
Years 2022 through 2030 and % CAGR
Table 90: Middle East Historic Review for Gambling Machines by
Application – Online and Offline Markets – Independent Analysis
of Annual Sales in US$ Million for Years 2014 through 2021 and
% CAGR
Table 91: Middle East 16-Year Perspective for Gambling Machines
by Application – Percentage Breakdown of Value Sales for Online
and Offline for the Years 2014, 2023 & 2030
IRAN
Table 92: Iran Recent Past, Current & Future Analysis for
Gambling Machines by Application – Online and Offline –
Independent Analysis of Annual Sales in US$ Million for the
Years 2022 through 2030 and % CAGR
Table 93: Iran Historic Review for Gambling Machines by
Application – Online and Offline Markets – Independent Analysis
of Annual Sales in US$ Million for Years 2014 through 2021 and
% CAGR
Table 94: Iran 16-Year Perspective for Gambling Machines by
Application – Percentage Breakdown of Value Sales for Online
and Offline for the Years 2014, 2023 & 2030
ISRAEL
Table 95: Israel Recent Past, Current & Future Analysis for
Gambling Machines by Application – Online and Offline –
Independent Analysis of Annual Sales in US$ Million for the
Years 2022 through 2030 and % CAGR
Table 96: Israel Historic Review for Gambling Machines by
Application – Online and Offline Markets – Independent Analysis
of Annual Sales in US$ Million for Years 2014 through 2021 and
% CAGR
Table 97: Israel 16-Year Perspective for Gambling Machines by
Application – Percentage Breakdown of Value Sales for Online
and Offline for the Years 2014, 2023 & 2030
SAUDI ARABIA
Table 98: Saudi Arabia Recent Past, Current & Future Analysis
for Gambling Machines by Application – Online and Offline –
Independent Analysis of Annual Sales in US$ Million for the
Years 2022 through 2030 and % CAGR
Table 99: Saudi Arabia Historic Review for Gambling Machines by
Application – Online and Offline Markets – Independent Analysis
of Annual Sales in US$ Million for Years 2014 through 2021 and
% CAGR
Table 100: Saudi Arabia 16-Year Perspective for Gambling
Machines by Application – Percentage Breakdown of Value Sales
for Online and Offline for the Years 2014, 2023 & 2030
UNITED ARAB EMIRATES
Table 101: UAE Recent Past, Current & Future Analysis for
Gambling Machines by Application – Online and Offline –
Independent Analysis of Annual Sales in US$ Million for the
Years 2022 through 2030 and % CAGR
Table 102: UAE Historic Review for Gambling Machines by
Application – Online and Offline Markets – Independent Analysis
of Annual Sales in US$ Million for Years 2014 through 2021 and
% CAGR
Table 103: UAE 16-Year Perspective for Gambling Machines by
Application – Percentage Breakdown of Value Sales for Online
and Offline for the Years 2014, 2023 & 2030
REST OF MIDDLE EAST
Table 104: Rest of Middle East Recent Past, Current & Future
Analysis for Gambling Machines by Application – Online and
Offline – Independent Analysis of Annual Sales in US$ Million
for the Years 2022 through 2030 and % CAGR
Table 105: Rest of Middle East Historic Review for Gambling
Machines by Application – Online and Offline Markets –
Independent Analysis of Annual Sales in US$ Million for Years
2014 through 2021 and % CAGR
Table 106: Rest of Middle East 16-Year Perspective for Gambling
Machines by Application – Percentage Breakdown of Value Sales
for Online and Offline for the Years 2014, 2023 & 2030
AFRICA
Gambling Machines Market Presence – Strong/Active/Niche/Trivial –
Key Competitors in Africa for 2023 (E)
Table 107: Africa Recent Past, Current & Future Analysis for
Gambling Machines by Application – Online and Offline –
Independent Analysis of Annual Sales in US$ Million for the
Years 2022 through 2030 and % CAGR
Table 108: Africa Historic Review for Gambling Machines by
Application – Online and Offline Markets – Independent Analysis
of Annual Sales in US$ Million for Years 2014 through 2021 and
% CAGR
Table 109: Africa 16-Year Perspective for Gambling Machines by
Application – Percentage Breakdown of Value Sales for Online
and Offline for the Years 2014, 2023 & 2030
IV. COMPETITION
Read the full report: https://www.reportlinker .com/p06031660/?utm_source=GNW

Latest News
OpticOdds Launches New Same Game Parlay Pricer and Suite of Data-Driven Trading Tools
OpticOdds, the premier feed provider for top operators, has unveiled three innovative tools in its expanding product suite: Trading Screen, Market Intelligence, and the SGP Pricer.
The OpticOdds Trading Screen, supporting over 150 sportsbooks in real-time, processes over one million odds per second across hundreds of servers. This ensures clients receive the fastest pre-match and in-play data, crucial for making informed decisions. Features like outlier, arbitrage, injury, and consensus alerts directly impact operators’ bottom lines. The enhanced data depth allows operators to drill into specific player markets, improving their pricing accuracy in historically challenging areas.
Market Intelligence offers the first programmatic view, enabling operators to see in real-time what markets their competitors are offering that they are not. It refreshes daily and provides insights into competitors’ holds, alternate markets, uptime, and release times.
The Same Game Parlay (SGP) Pricer allows operators to query top sportsbooks to see how correlations are priced in real-time. For instance, during the Chiefs vs. 49ers 2024 Super Bowl, SGPs accounted for roughly 25% of the betting volume at major online sportsbooks. SGPs, particularly those with numerous legs, are notoriously difficult to price due to correlations. The OpticOdds SGP Pricer also algorithmically generates pre-packaged SGP recommendations.
Ryan Weinstock, Chief Commercial Officer at OpticOdds, commented: “Last year, I spent many days on the road meeting with clients. The most frequent conversation was about the lack of automated solutions in trading. More operators recognize the power of real-time data and want to leverage it. While many operators have internal solutions, these often rely on legacy providers using outdated technology. That’s why we are building real-time, low-integration trading solutions to deliver immediate value to our clients.”
The post OpticOdds Launches New Same Game Parlay Pricer and Suite of Data-Driven Trading Tools appeared first on European Gaming Industry News.
Latest News
Record World Pool turnover on Lockinge Stakes Day at Newbury
World Pool, the largest globally commingled horse racing pools created and powered by the Hong Kong Jockey Club, saw record turnover on Lockinge Stakes Day, with the fixture featuring five World Pool races for the first time, an increase from two races in 2023.
Across the five races on the card, total turnover from World Pool bet types hit HK$145.3 million (approx. £14.6 million), up from HK$66 million (approx. £6.7 million) last year.
There was a surprise result in the feature G1 Lockinge Stakes, as Audience, the runner many thought was a pacemaker for his better fancied stablemate Inspiral, never saw another rival and came home in front under rider Rab Havlin. It marked a second win at the highest level for Havlin, and a second Lockinge Stakes for John & Thady Gosden.
For the third time this season, the UK & Irish Jockeys’ Championship saw riders compete for points determined by World Pool dividends, and while Silvestre de Sousa remained top on 44.10 points, there was plenty of movement in the top five.
Audience’s win at a World Pool dividend of 21.85 was enough to catapult Rab Havlin into the top five, and meant he emerged as the leading rider on the day.
Clifford Lee notched a double, with Elite Status winning the Listed Carnarvon Stakes at a World Pool dividend of 6.95 and Lethal Levi landing the HKJC World Pool handicap at a dividend of 8.80. It was Lee’s third win of the Championship and saw him rise to fourth in the table on 27.00 points.
Oisin Murphy maintained his position in third place with a win in the G3 Aston Park Stakes aboard Middle Earth (3.65), while William Buick was also successful on the day, riding King’s Gambit (4.80) to an impressive success in the London Gold Cup Handicap.
Next up for World Pool will be a debut on Irish 1000 Guineas at the Curragh on Saturday May 26, and following that a return to the UK for a full card of races on Derby Day from Epsom on Saturday June 1, while the globally comingled pools will also be in action on the same day from Eagle Farm for Queensland Derby Day.
Upcoming World Pool events in the next three months:
May
Sunday 26: Irish 1000 Guineas Day – Curragh Racecourse (P)
June
Saturday 1: Queensland Derby Day – Eagle Farm Racecourse (P)
Saturday 1: Derby Stakes Day – Epsom Racecourse (F)
Saturday 8: Gold Challenge – Greyville Racecourse (S)
Saturday 15: Stradbroke Handicap Day – Eagle Farm Racecourse (P)
Tuesday 18: Queen Anne Stakes Day – Ascot Racecourse (F)
Wednesday 19: Prince of Wales’s Stakes Day – Ascot Racecourse (F)
Thursday 20: Gold Cup Day – Ascot Racecourse (F)
Friday 21: Commonwealth Cup Day – Ascot Racecourse (F)
Saturday 22: Queen Elizabeth II Jubilee Stakes Day – Ascot Racecourse (F)
Sunday 30: Irish Derby Day – Curragh Racecourse (F)
July
Saturday 6: Eclipse Stakes – Sandown Racecourse (S)
Saturday 6: Durban July – Greyville Racecourse (S)
Sunday 7: Deutsches Derby Day – Hamburg Racecourse (P)
Saturday 27: King George VI & Queen Elizabeth Stakes Day – Ascot Racecourse (F)
Sunday 28: Champions Cup Day – Geryville Racecourse (P)
Sunday 28: Grosser Preis Bayerisches Zuchtrennen Day – Munich Racecourse (P)
Tuesday 30: Goodwood Cup Day – Goodwood Racecourse (F)
Wednesday 31: Sussex Stakes Day – Goodwood Racecourse (F)
*F: Full meeting – World Pool coverage on all races in the relevant meeting
P: Part meeting – World Pool coverage only on selected races in the relevant meeting
S: Single race – World Pool coverage only on this race in the relevant meeting
The post Record World Pool turnover on Lockinge Stakes Day at Newbury appeared first on European Gaming Industry News.
Latest News
Top-Tier Mobile Game Publishers Spend $21 Million on Custom Tech
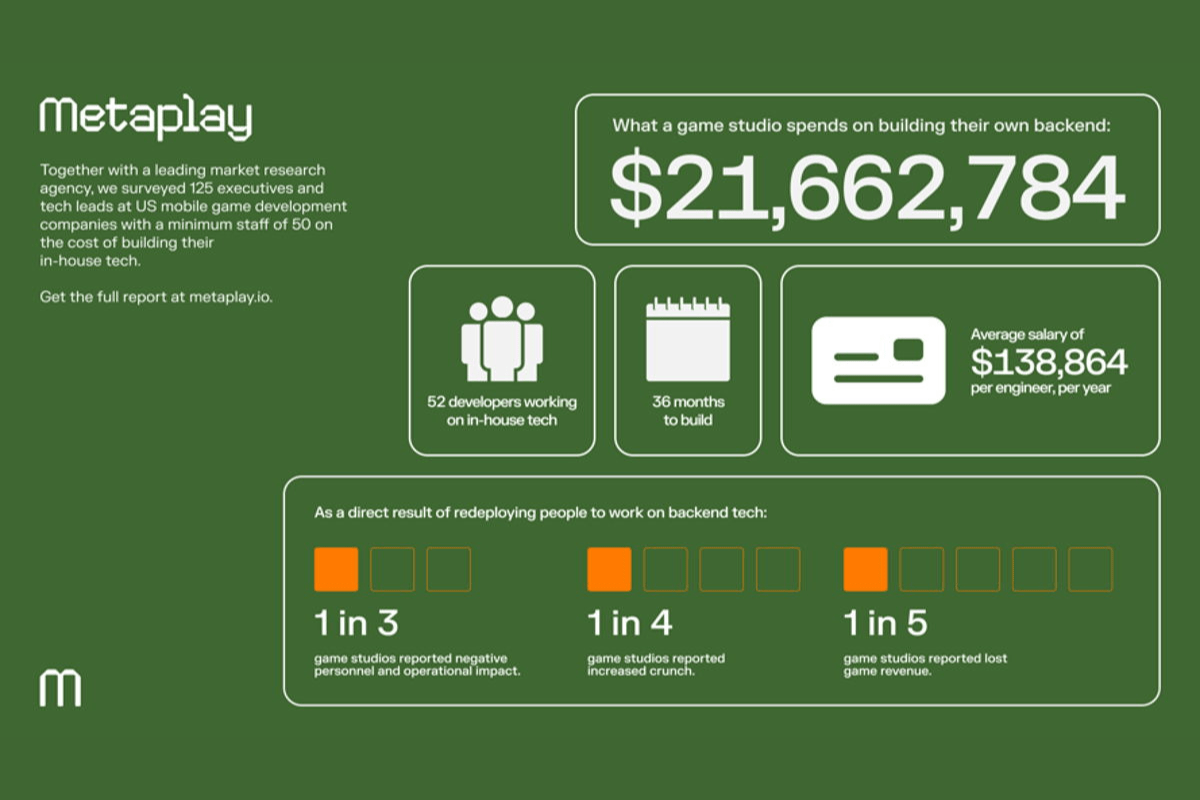
Top-tier mobile game publishers are investing more than $21 million to build and maintain internal technology and tooling. That’s the startling headline of new research from mobile game development company, Metaplay, which also dives into the hidden, human costs of game programmers who are diverted to work on tech instead of gaming content.
Based on a survey of 125 senior executives at large mobile game development companies in the United States, the data shows that large publishers are spending an average of $21,662,784 to build and maintain their backend tech. Respondents, all of whom are C-level execs or tech team leads at companies with at least 50 staff, were asked questions relating to the size of their tech teams, how long they had been working on internal tools, and their teams’ remuneration. They said:
-
$138,864 is the average salary of an employee working on internal tech at major publishers in the United States
-
52 is the average number of employees working predominantly in internal tech
-
36 months is the average number of months the companies surveyed had been building internal tech (just over three years)
Beyond the hard numbers, there are human costs associated with the in-house development of backend tech. Almost three-quarters (74%) of respondents said their game programmers had been impacted by being redeployed to work on internal tech as opposed to gaming content. Of those who had redeployed staff, 41% said that doing so had slowed the game development process, 34% said it had increased ‘crunch’ working practices, and 34% said this led to higher employee turnover.
Teemu Haila, co-founder and Chief Product Officer at Metaplay, commented:
“As a company which has spent almost four years focused entirely on building backend tech for mobile games, even we had to do a double-take when we saw these stats. Shipping a long-lasting hit game was already very challenging, but the current state of the mobile gaming market means investment at this level without any guarantee of success is incredibly risky. We’re trying to fix the binary choice of ‘build vs buy’ when it comes to backend tech – where ‘build’ means expensive and ‘buy’ means unscalable, so mobile devs can focus on making great content.”
Matt Wilson, mobile gaming advisor and investor, said:
“This research shows that building internal tech is becoming prohibitively expensive as well as distracting game-makers from their day jobs. As an investor, I generally want to see as much capital as possible to go towards developing the product. Many companies still suffer from an ‘if it’s not built here, it’s not good enough’ mentality but, while that may have been true in the past, it’s certainly not always the case now.”
Further key findings from the research:
-
Top-tier game studios in the US are most likely to be developing strategy games (58%) and shooters (57%). They’re least likely to be working on hypercasual (22%) and card-collecting games (18%)
-
Respondents’ companies are most likely to outsource or use third-party tooling for security and compliance (43%), multiplayer and/or matchmaking (42%), and game logic server hosting (41%). They’re least likely to outsource observability tooling (26%), and data pipelines (14%)
As well as being available as a whitepaper here, the research has today been released as a hard copy book which is available at Nordic Game Conference stand D6, or on request from Metaplay.
The post Top-Tier Mobile Game Publishers Spend $21 Million on Custom Tech appeared first on European Gaming Industry News.
-

 Latest News3 months ago
Fairplay Exchange signs as new sponsor of Stephen Hendry’s Cue Tips
-

 Latest News3 months ago
Gods Reign Announces Groundbreaking Partnership with LG Electronics
-

 Latest News3 months ago
European Gaming Q1 2024 Meetup: Exploring Innovation, Marketing, and the iGaming Industry Hubs
-
Latest News3 months ago
Casino Crypto Giant Bitline Partners with Ciphertrace for Enhanced Compliance in Digital Asset Transactions
-

 Latest News3 months ago
French Publisher TapNation tops Financial Times FT1000 list of Europe’s Leaders in Tech Media
-

 Latest News3 months ago
Hölle Games Go Live on Bet-at-home.de
-

 Latest News3 months ago
PAGCor Says 188BET’s Return to the Philippines a Huge Vote of Confidence
-

 Latest News2 months ago
Stakelogic’s Slot and Live Casino Content is now live with L&L Europe

















You must be logged in to post a comment Login