Latest News
International Game Technology PLC Reports Third Quarter 2018 Results
 Reading Time: 15 minutes
– Solid Lottery and Gaming KPIs drive strong third quarter results
– Net income was $22 million in the third quarter; Adjusted net income was $64 million
– Adjusted EBITDA of $443 million reflects strong Italy and global Lottery performance
– Full-year Adjusted EBITDA outlook narrowed to $1,740 – $1,780 million, the top half of the prior range
– Cash dividend declared of $0.20 per ordinary share
International Game Technology PLC (“IGT”) (NYSE:IGT) today reported financial results for the third quarter ended September 30, 2018. Today, at 8:00 a.m. EDT, management will host a conference call and webcast to present the third quarter results; access details are provided below.
“Solid performance and important, long-term contracts drove very good third quarter and year-to-date results,” said Marco Sala, CEO of IGT. “Global Lottery same-store revenues for instants and draw games rose mid-single digits. The installed base of gaming machines was up, and unit shipments of gaming machines increased 10%. And, we enjoyed particularly strong sales and profit growth in Italy, confirming the vitality of that important market. We are firmly on track to achieve our 2018 financial and operational goals.”
“We’ve delivered Adjusted EBITDA growth of 4% and 7% for the third quarter and year-to-date periods at constant currency and scope,” said Alberto Fornaro, CFO of IGT. “As a result, we are narrowing our Adjusted EBITDA outlook for 2018 to $1,740 – $1,780 million, the top half of the prior range.”
Overview of Consolidated Third Quarter Results
|
Quarter Ended |
Y/Y |
Constant |
||
|
2018(1) |
2017 |
(%) |
(%) |
|
|
(In $ millions, unless otherwise noted) |
||||
|
Revenue |
1,156 |
1,221 |
-5% |
-4% |
|
Operating income |
200 |
(556) |
NM |
|
|
Net income/(loss) per diluted share |
$0.11 |
($3.95) |
NM |
|
|
Net debt |
7,570 |
7,335 |
3% |
|
|
Adjusted EBITDA |
443 |
428 |
3% |
4% |
|
Adjusted operating income |
257 |
258 |
0% |
0% |
|
Adjusted net income per diluted share |
$0.31 |
$0.40 |
-23% |
|
|
Note: Adjusted EBITDA, adjusted operating income, and adjusted net income per diluted share are non-GAAP financial measures. Reconciliations of non-GAAP financial measures to the most directly comparable GAAP financial measures are provided at the end of this news release. |
|
(1) On January 1, 2018, IGT adopted ASU 2014-09 (Topic 606), Revenue from Contracts with Customers (“ASC 606”). This negatively impacted Revenue in the third quarter by $22 million and positively impacted Adjusted EBITDA by $12 million. Comparative schedules summarizing the impact on the third quarter and nine months ended September 30, 2018 Condensed Consolidated Statements of Operations are included later in this release. |
Consolidated revenue was $1,156 million, down 4% at constant currency
- $22 million negative impact due to ASC 606
- Impacted by lumpiness of product sales and timing of multi-state jackpots
- Strong global Lottery performance, improved Gaming KPIs, and broad-based strength in Italy
Adjusted EBITDA rose 3% to $443 million; Adjusted operating income was unchanged from prior year at $257 million
- Disciplined expense management more than offset lower revenue
- Adjusted operating income includes higher depreciation associated with recent Lottery contract extensions and upgrading of Gaming installed base
Interest expense was $107 million compared to $114 million in prior-year quarter
Provision for income taxes was $46 million compared to a benefit of $20 million in the prior-year period
Net income attributable to IGT was $22 million in the quarter; Adjusted net income attributable to IGT was $64 million
Net income per diluted share of $0.11; Adjusted net income per diluted share of $0.31
Cash from operations was $249 million for the first nine months of the year and capital expenditures were $374 million
- $366 million (gross) upfront payments for the Scratch & Win license in Italy
Cash and cash equivalents were $448 million as of September 30, 2018, compared to $1,057 million as of December 31, 2017
Net debt was $7,570 million as of September 30, 2018, compared to $7,319 million as of December 31, 2017
Operating Segment Review
North America Gaming & Interactive
|
Select Financial Data |
Constant |
Key Performance Indicators |
% |
||||||||
|
Period Ended September 30 |
Q3 ’18 |
Q3 ’17 |
FX |
Period Ended September 30 |
Q3 ’18 |
Q3 ’17 |
Change |
||||
|
Gaming |
Total Revenue |
231 |
262 |
-12% |
Installed base (end of period) |
||||||
|
Gaming Services |
152 |
171 |
-11% |
Casino |
23,357 |
22,924 |
1.9% |
||||
|
Terminal |
106 |
123 |
-14% |
||||||||
|
Social (DDI) |
0 |
0 |
0% |
Machine units shipped |
|||||||
|
Other |
46 |
48 |
-4% |
New/Expansion |
843 |
729 |
15.6% |
||||
|
Product Sales |
79 |
91 |
-13% |
Replacement |
2,998 |
2,868 |
4.5% |
||||
|
Terminal |
54 |
46 |
17% |
Total machines shipped |
3,841 |
3,597 |
6.8% |
||||
|
Other |
25 |
44 |
-44% |
||||||||
|
Total |
Revenue |
231 |
262 |
-12% |
|||||||
|
Operating Income |
45 |
65 |
-33% |
||||||||
Revenue of $231 million compared to $262 million in the prior-year quarter
- Decline of $14 million, or 5%, after adjusting for $17 million jackpot expense reclass
- Gaming services revenue of $152 million compared to $171 million in the prior year
- Stable after adjusting for jackpot expense reclass
- Installed base up 433 units from prior year; yields and installed base stable sequentially
- Product sales revenue of $79 million compared to $91 million in the prior year
- 16% increase in terminal sale revenue includes growth in casino replacement and VLT units, higher average selling prices
- Large software sale in prior year
Operating income of $45 million compared to $65 million in the prior-year quarter
- Large, high-margin product sales mix in the prior year
- Increased depreciation related to upgrading installed base
- Timing of jackpots
North America Lottery
|
Select Financial Data |
Constant |
Key Performance Indicators |
% |
||||||||
|
Period Ended September 30 |
Q3 ’18 |
Q3 ’17 |
FX |
Period Ended September 30 |
Q3 ’18 |
Q3 ’17 |
Change |
||||
|
Gaming |
Total Revenue |
37 |
48 |
-22% |
Installed base (end of period) |
||||||
|
Gaming Services |
37 |
40 |
-6% |
VLT – Government Sponsored |
14,965 |
15,225 |
-1.7% |
||||
|
Terminal |
25 |
25 |
-1% |
||||||||
|
Other |
12 |
14 |
-16% |
Lottery same-store revenue growth |
|||||||
|
Product Sales |
0 |
8 |
-98% |
Instants & draw games |
4.8% |
||||||
|
Multistate Jackpots |
-25.9% |
||||||||||
|
Lottery |
Total Revenue |
242 |
259 |
-7% |
Total lottery same-store revenue growth |
-0.6% |
|||||
|
Lottery Services |
225 |
237 |
-5% |
||||||||
|
FM/Concessions |
164 |
170 |
-4% |
||||||||
|
LMA |
25 |
34 |
-25% |
||||||||
|
Other Services |
36 |
33 |
8% |
||||||||
|
Product Sales |
17 |
22 |
-22% |
||||||||
|
Terminal |
0 |
1 |
-100% |
||||||||
|
Systems/Other |
17 |
22 |
-20% |
||||||||
|
Total |
Revenue |
279 |
307 |
-9% |
|||||||
|
Operating Income |
60 |
75 |
-20% |
||||||||
Revenue of $279 million compared to $307 million in prior-year period
- Lottery service revenue down 5% to $225 million
- 4.8% same-store revenue growth for instant tickets and draw-based games more than offset by significantly lower multistate jackpot activity
- Lower LMA revenue from Illinois
- Lottery product sales of $17 million compared to $22 million in prior year
- Growth in instant ticket printing
- Large VLT system and lottery terminal sales in prior year
Operating income of $60 million compared to $75 million in prior-year period
- Tough jackpot and product sales revenue comparisons
- Higher depreciation related to recent contract wins and extensions
International
|
Select Financial Data |
Constant |
Key Performance Indicators |
% |
||||||||
|
Period Ended September 30 |
Q3 ’18 |
Q3 ’17 |
FX |
Period Ended September 30 |
Q3 ’18 |
Q3 ’17 |
Change |
||||
|
Gaming |
Total Revenue |
98 |
128 |
-20% |
Installed base (end of period) |
||||||
|
Gaming Services |
33 |
59 |
-40% |
Casino |
12,332 |
13,022 |
-5.3% |
||||
|
Terminal |
13 |
14 |
7% |
VLT – Government Sponsored |
3,675 |
1,569 |
134.2% |
||||
|
Other |
19 |
45 |
-55% |
Total installed base |
16,007 |
14,591 |
9.7% |
||||
|
Product Sales |
65 |
69 |
-2% |
||||||||
|
Terminal |
47 |
43 |
15% |
Machine units shipped |
|||||||
|
Other |
18 |
26 |
-30% |
New/Expansion |
529 |
176 |
200.6% |
||||
|
Replacement |
2,681 |
2,633 |
1.8% |
||||||||
|
Lottery |
Total Revenue |
100 |
82 |
23% |
Total machines shipped |
3,210 |
2,809 |
14.3% |
|||
|
Lottery Services |
69 |
70 |
0% |
||||||||
|
FM/Concessions |
54 |
52 |
6% |
Lottery same-store revenue growth |
|||||||
|
Other Services |
15 |
18 |
-18% |
Instants & draw games |
3.8% |
||||||
|
Product Sales |
31 |
12 |
162% |
Multistate Jackpots |
2.7% |
||||||
|
Systems/Other |
31 |
12 |
162% |
Total lottery same-store revenue growth |
3.7% |
||||||
|
Other |
Total Revenue |
18 |
24 |
-23% |
|||||||
|
Service Revenue |
17 |
18 |
-1% |
||||||||
|
Product Sales |
0 |
6 |
-92% |
||||||||
|
Total |
Revenue |
216 |
234 |
-5% |
|||||||
|
Operating Income |
56 |
40 |
46% |
||||||||
Revenue down 5% in constant currency to $216 million
- Stable Lottery service revenue
- Same-store revenue growth of 3.7%
- Lower non-wager revenue compared to prior year
- Significant increase in Lottery product sales from large, multi-year software license
- Gaming service revenue of $33 million compared to $59 million in the prior year
- Prior year had benefit of certain discrete, non-recurring items
- Jackpot expense reclass of $3 million
- Service revenue from terminals up high single-digits at constant currency from growth in the installed base
- Gaming product sales revenue down 2% in constant currency to $65 million
- 14% increase in gaming machine unit shipments; higher average selling prices
- Lower systems revenue
Operating income up 46% at constant currency to $56 million
- High-margin software license sale
- Disciplined expense management
Italy
|
Select Financial Data |
Constant |
Key Performance Indicators |
% |
||||||||
|
Period Ended September 30 |
Q3 ’18 |
Q3 ’17 |
FX |
Period Ended September 30 |
Q3 ’18 |
Q3 ’17 |
Change |
||||
|
Gaming |
Total Revenue |
175 |
173 |
2% |
(In € millions, except machines) |
||||||
|
Gaming Services |
175 |
173 |
2% |
Lottery |
|||||||
|
Terminal |
159 |
157 |
2% |
Lotto wagers |
1,913 |
1,815 |
5.4% |
||||
|
Other |
16 |
16 |
5% |
10eLotto |
1,361 |
1,261 |
7.9% |
||||
|
Product Sales |
0 |
0 |
0% |
Core |
434 |
494 |
-12.2% |
||||
|
Late Numbers |
70 |
60 |
17.9% |
||||||||
|
Lottery |
Total Revenue |
184 |
180 |
4% |
MillionDAY |
47 |
– |
NM |
|||
|
Lottery Services |
184 |
180 |
4% |
||||||||
|
FM/Concessions |
233 |
229 |
3% |
Scratch & Win Wagers |
2,179 |
2,198 |
-0.9% |
||||
|
Other Services |
(49) |
(50) |
-1% |
||||||||
|
Product Sales |
0 |
0 |
0% |
Italy lottery revenue growth |
3.6% |
||||||
|
Other |
Total Revenue |
70 |
66 |
8% |
Gaming |
||||||
|
Service Revenue |
70 |
66 |
8% |
Installed base (end of period) |
|||||||
|
Product Sales |
0 |
0 |
0% |
VLT – Operator (B2C) |
11,027 |
10,958 |
0.6% |
||||
|
VLT – Supplier (B2B) |
8,094 |
8,752 |
-7.5% |
||||||||
|
Total |
Revenue |
430 |
418 |
4% |
AWP |
43,074 |
59,084 |
-27.1% |
|||
|
Operating Income |
145 |
126 |
17% |
Total Installed Base |
62,195 |
78,794 |
-21.1% |
||||
|
Wagers |
|||||||||||
|
VLT – Operator (B2C) |
1,426 |
1,329 |
7.3% |
||||||||
|
AWP |
879 |
948 |
-7.2% |
||||||||
|
Interactive Wagers (Gaming) |
447 |
404 |
10.5% |
||||||||
|
Other |
|||||||||||
|
Sports Betting Wagers1 |
225 |
204 |
9.9% |
||||||||
|
Sports Betting Payout (%)1 |
81.1% |
83.3% |
-2.1 pp |
||||||||
|
1Includes Virtual Wagers and Pools & Horses |
|||||||||||
Revenue up 4% at constant currency to $430 million with growth across all Gaming businesses
- Lottery Service revenue up to $184 million from $180 million in the prior year
- Lotto wagers up 5.4% on continued strength in 10eLotto and contribution from MillionDAY
- Scratch & Win wagers down modestly on comparison with successful relaunch of Miliardario in the prior-year period
- Gaming Service revenue up 2% at constant currency
- Higher revenue despite state-mandated reductions in AWP units, incremental taxes, and certain regional restrictions
- Strong underlying productivity
- Sports betting wagers increased 9.9% to €225 million, payout 210 basis points better
Operating income increased to $145 million, up 17% at constant currency
- Strong profit flow-through, especially for Lotteries
- Disciplined cost management
Other Developments
The Company’s board of directors declared a quarterly cash dividend of $0.20 per ordinary share
- Record date of November 14, 2018
- Payment date of November 28, 2018
Recent Capital Markets Activity
- Issuance of $750 million 6.25% Senior Secured Notes due 2027
- Net proceeds used to redeem $600 million 5.625% bonds due 2020, $144 million 7.50% notes due 2019, and $97 million of its 5.5% bonds due 2020, with the balance funded through utilization of the revolving credit facility
- Average debt maturity extended to over 4 years
Full Year Outlook
- Narrowing 2018 Adjusted EBITDA outlook to $1,740 – $1,780 million at a EUR/USD rate of 1.19, the top half of the prior range
- Continue to expect capital expenditures of $575–$625 million
Conference Call and Webcast
October 31, 2018, at 8:00 a.m. EDT
Live webcast available under “News, Events & Presentations” on IGT’s Investor Relations website at www.IGT.com; replay available on the website following the live event
Dial-In Numbers
- US/Canada toll-free dial-in number is +1 844 842 7999
- Outside the US/Canada toll-free number is +1 612 979 9887
- Conference ID/confirmation code is 9277539
- A telephone replay of the call will be available for one week
- US/Canada replay number is +1 855 859 2056
- Outside the US/Canada replay number is +1 404 537 3406
- ID/Confirmation code is 9277539
Comparability of Results
All figures presented in this news release are prepared under U.S. GAAP, unless noted otherwise. Adjusted figures exclude the impact of items such as purchase accounting, impairment charges, restructuring expense, foreign exchange, and certain one-time, primarily transaction-related items. Reconciliations to the most directly comparable U.S. GAAP measures are included in the tables in this news release. Constant currency changes for 2018 are calculated using the same foreign exchange rates as the corresponding 2017 period. Management uses non-GAAP financial measures to understand and compare operating results across accounting periods, for internal budgeting and forecasting purposes, and to evaluate the Company’s financial performance. Management believes these non-GAAP financial measures reflect the Company’s ongoing business in a manner that allows for meaningful period-to-period comparisons and analysis of business trends. These constant currency changes and non-GAAP financial measures should however be viewed in addition to, and not as an alternative for, the Company’s reported results prepared in accordance with U.S. GAAP.
About IGT
IGT (NYSE:IGT) is the global leader in gaming. We enable players to experience their favorite games across all channels and regulated segments, from Gaming Machines and Lotteries to Digital and Social Gaming. Leveraging a wealth of premium content, substantial investment in innovation, in-depth customer intelligence, operational expertise and leading-edge technology, our gaming solutions anticipate the demands of consumers wherever they decide to play. We have a well-established local presence and relationships with governments and regulators in more than 100 countries around the world, and create value by adhering to the highest standards of service, integrity, and responsibility. IGT has over 12,000 employees. For more information, please visit www.IGT.com.
Cautionary Statement Regarding Forward-Looking Statements
This news release may contain forward-looking statements (including within the meaning of the Private Securities Litigation Reform Act of 1995) concerning International Game Technology PLC and its consolidated subsidiaries (the “Company”) and other matters. These statements may discuss goals, intentions, and expectations as to future plans, trends, events, dividends, results of operations, or financial condition, or otherwise, based on current beliefs of the management of the Company as well as assumptions made by, and information currently available to, such management. Forward-looking statements may be accompanied by words such as “aim,” “anticipate,” “believe,” “plan,” “could,” “would,” “should,” “shall”, “continue,” “estimate,” “expect,” “forecast,” “future,” “guidance,” “intend,” “may,” “will,” “possible,” “potential,” “predict,” “project” or the negative or other variations of them. These forward-looking statements speak only as of the date on which such statements are made and are subject to various risks and uncertainties, many of which are outside the Company’s control. Should one or more of these risks or uncertainties materialize, or should any of the underlying assumptions prove incorrect, actual results may differ materially from those predicted in the forward-looking statements and from past results, performance, or achievements. Therefore, you should not place undue reliance on such statements. Factors that could cause actual results to differ materially from those in the forward-looking statements include (but are not limited to) the factors and risks described in the Company’s annual report on Form 20-F for the financial year ended December 31, 2017 and other documents filed from time to time with the SEC, which are available on the SEC’s website at www.sec.gov and on the investor relations section of the Company’s website at www.IGT.com. Except as required under applicable law, the Company does not assume any obligation to update these forward-looking statements. You should carefully consider these factors and other risks and uncertainties that affect the Company’s business. All forward-looking statements contained in this news release are qualified in their entirety by this cautionary statement.
Contact:
Robert K. Vincent, Corporate Communications, toll free in U.S./Canada +1 (844) IGT-7452; outside U.S./Canada +1 (401) 392-7452
James Hurley, Investor Relations, +1 (401) 392-7190
Simone Cantagallo, +39 06 51899030; for Italian media inquiries
|
International Game Technology PLC |
|||
|
Condensed Consolidated Statements of Operations |
|||
|
($ and shares in thousands, except per share data) |
|||
|
Unaudited |
|||
|
For the three months ended |
|||
|
September 30, |
|||
|
2018 |
2017 |
||
|
Service revenue |
963,265 |
1,013,054 |
|
|
Product sales |
192,565 |
208,147 |
|
|
Total revenue |
1,155,830 |
1,221,201 |
|
|
Cost of services |
586,811 |
625,247 |
|
|
Cost of product sales |
107,311 |
150,358 |
|
|
Selling, general and administrative |
194,099 |
196,862 |
|
|
Research and development |
63,277 |
79,009 |
|
|
Restructuring expense |
2,768 |
9,976 |
|
|
Impairment loss |
1,530 |
715,220 |
|
|
Transaction expense, net |
6 |
627 |
|
|
Total operating expenses |
955,802 |
1,777,299 |
|
|
Operating income (loss) |
200,028 |
(556,098) |
|
|
Interest income |
3,249 |
2,906 |
|
|
Interest expense |
(106,802) |
(113,711) |
|
|
Foreign exchange gain (loss), net |
21,104 |
(117,526) |
|
|
Other expense, net |
(17,244) |
(9,802) |
|
|
Total non-operating expenses |
(99,693) |
(238,133) |
|
|
Income (loss) before provision for (benefit from) income taxes |
100,335 |
(794,231) |
|
|
Provision for (benefit from) income taxes |
46,327 |
(19,824) |
|
|
Net income (loss) |
54,008 |
(774,407) |
|
|
Less: Net income attributable to non-controlling interests |
31,709 |
29,207 |
|
|
Net income (loss) attributable to IGT PLC |
22,299 |
(803,614) |
|
|
Net income (loss) attributable to IGT PLC per common share – basic |
0.11 |
(3.95) |
|
|
Net income (loss) attributable to IGT PLC per common share – diluted |
0.11 |
(3.95) |
|
|
Weighted-average shares – basic |
204,219 |
203,489 |
|
|
Weighted-average shares – diluted |
204,344 |
203,489 |
|
|
International Game Technology PLC |
|||
|
Condensed Consolidated Statements of Operations |
|||
|
($ and shares in thousands, except per share data) |
|||
|
Unaudited |
|||
|
For the nine months ended |
|||
|
September 30, |
|||
|
2018 |
2017 |
||
|
Service revenue |
3,017,283 |
3,063,477 |
|
|
Product sales |
547,841 |
529,812 |
|
|
Total revenue |
3,565,124 |
3,593,289 |
|
|
Cost of services |
1,812,553 |
1,866,281 |
|
|
Cost of product sales |
333,065 |
403,056 |
|
|
Selling, general and administrative |
605,405 |
607,571 |
|
|
Research and development |
198,497 |
242,142 |
|
|
Restructuring expense |
7,924 |
30,706 |
|
|
Impairment loss |
1,530 |
715,220 |
|
|
Transaction expense (income), net |
50 |
(26,682) |
|
|
Total operating expenses |
2,959,024 |
3,838,294 |
|
|
Operating income (loss) |
606,100 |
(245,005) |
|
|
Interest income |
9,599 |
7,992 |
|
|
Interest expense |
(323,320) |
(344,494) |
|
|
Foreign exchange gain (loss), net |
96,955 |
(384,749) |
|
|
Other expense, net |
(45,567) |
(33,247) |
|
|
Total non-operating expenses |
(262,333) |
(754,498) |
|
|
Income (loss) before provision for income taxes |
343,767 |
(999,503) |
|
|
Provision for income taxes |
159,064 |
53,932 |
|
|
Net income (loss) |
184,703 |
(1,053,435) |
|
|
Less: Net income attributable to non-controlling interests |
104,054 |
94,870 |
|
|
Net income (loss) attributable to IGT PLC |
80,649 |
(1,148,305) |
|
|
Net income (loss) attributable to IGT PLC per common share – basic |
0.40 |
(5.66) |
|
|
Net income (loss) attributable to IGT PLC per common share – diluted |
0.39 |
(5.66) |
|
|
Weighted-average shares – basic |
204,009 |
203,002 |
|
|
Weighted-average shares – diluted |
204,375 |
203,002 |
|
|
International Game Technology PLC |
|||
|
Condensed Consolidated Balance Sheets |
|||
|
($ thousands) |
|||
|
Unaudited |
|||
|
September 30, |
December 31, |
||
|
2018 |
2017 |
||
|
Assets |
|||
|
Current assets: |
|||
|
Cash and cash equivalents |
447,550 |
1,057,418 |
|
|
Restricted cash and cash equivalents |
255,470 |
248,012 |
|
|
Trade and other receivables, net |
821,764 |
937,854 |
|
|
Inventories, net |
332,921 |
319,545 |
|
|
Other current assets |
469,741 |
407,520 |
|
|
Income taxes receivable |
50,298 |
94,168 |
|
|
Total current assets |
2,377,744 |
3,064,517 |
|
|
Systems, equipment and other assets related to contracts, net |
1,390,707 |
1,434,194 |
|
|
Property, plant and equipment, net |
184,425 |
193,723 |
|
|
Goodwill |
5,697,030 |
5,723,815 |
|
|
Intangible assets, net |
2,088,573 |
2,273,460 |
|
|
Other non-current assets |
2,206,794 |
2,427,953 |
|
|
Deferred income taxes |
37,706 |
41,546 |
|
|
Total non-current assets |
11,605,235 |
12,094,691 |
|
|
Total assets |
13,982,979 |
15,159,208 |
|
|
Liabilities, redeemable non-controlling interests, and shareholders’ equity |
|||
|
Current liabilities: |
|||
|
Accounts payable |
1,040,701 |
1,240,753 |
|
|
Other current liabilities |
1,161,113 |
1,780,875 |
|
|
Current portion of long-term debt |
– |
599,114 |
|
|
Short-term borrowings |
29,957 |
– |
|
|
Income taxes payable |
82,127 |
55,935 |
|
|
Total current liabilities |
2,313,898 |
3,676,677 |
|
|
Long-term debt, less current portion |
7,987,583 |
7,777,445 |
|
|
Deferred income taxes |
493,605 |
491,460 |
|
|
Income taxes payable |
25,654 |
55,665 |
|
|
Other non-current liabilities |
450,951 |
446,113 |
|
|
Total non-current liabilities |
8,957,793 |
8,770,683 |
|
|
Total liabilities |
11,271,691 |
12,447,360 |
|
|
Commitments and contingencies |
|||
|
Redeemable non-controlling interests and shareholders’ equity |
2,711,288 |
2,711,848 |
|
|
Total liabilities, redeemable non-controlling interests, and shareholders’ equity |
13,982,979 |
15,159,208 |
|
|
Condensed Consolidated Statements of Cash Flows |
||||
|
($ thousands) |
||||
|
Unaudited |
||||
|
For the nine months ended |
||||
|
September 30, |
||||
|
2018 |
2017 |
|||
|
Cash flows from operating activities |
||||
|
Net income (loss) |
184,703 |
(1,053,435) |
||
|
Adjustments to reconcile net loss to net cash provided by operating activities: |
||||
|
Depreciation |
312,203 |
289,088 |
||
|
Amortization |
204,256 |
317,989 |
||
|
Service revenue amortization |
164,952 |
155,318 |
||
|
Loss on extinguishment of debt |
49,460 |
35,428 |
||
|
Stock-based compensation expense |
24,944 |
5,102 |
||
|
Debt issuance cost amortization |
16,511 |
16,602 |
||
|
Deferred income tax provision |
11,815 |
(170,698) |
||
|
Impairment loss |
1,530 |
715,220 |
||
|
Foreign exchange (gain) loss, net |
(96,955) |
384,749 |
||
|
Gain on sale of Double Down Interactive LLC |
– |
(51,348) |
||
|
Other non-cash costs, net |
3,132 |
8,428 |
||
|
Changes in operating assets and liabilities: |
||||
|
Trade and other receivables |
92,823 |
42,023 |
||
|
Inventories |
(26,682) |
16,526 |
||
|
Upfront Italian license fees |
(366,270) |
(185,368) |
||
|
Accounts payable |
(123,057) |
(60,733) |
||
|
Other assets and liabilities |
(204,053) |
(67,954) |
||
|
Net cash provided by operating activities |
249,312 |
396,937 |
||
|
Cash flows from investing activities |
||||
|
Capital expenditures |
(374,313) |
(552,169) |
||
|
Proceeds from sale of assets |
8,200 |
168,201 |
||
|
Proceeds from sale of Double Down Interactive LLC, net of cash divested |
– |
823,788 |
||
|
Other |
2,064 |
1,990 |
||
|
Net cash (used in) provided by investing activities |
(364,049) |
441,810 |
||
|
Cash flows from financing activities |
||||
|
Principal payments on long-term debt |
(1,658,753) |
(1,601,134) |
||
|
Dividends paid – non-controlling interests |
(126,926) |
(51,508) |
||
|
Dividends paid |
(122,394) |
(121,840) |
||
|
Return of capital – non-controlling interests |
(64,974) |
(62,538) |
||
|
Net payments of financial liabilities |
(36,407) |
(32,495) |
||
|
Payments in connection with the extinguishment of debt |
(42,148) |
(38,832) |
||
|
Debt issuance costs paid |
(10,199) |
(16,350) |
||
|
Net proceeds from short-term borrowings |
29,957 |
– |
||
|
Capital increase – non-controlling interests |
135,536 |
127,211 |
||
|
Proceeds from long-term debt |
1,415,762 |
938,160 |
||
|
Other |
(18,051) |
(24,785) |
||
|
Net cash used in financing activities |
(498,597) |
(884,111) |
||
|
Net decrease in cash and cash equivalents, and restricted cash |
(613,334) |
(45,364) |
||
|
Effect of exchange rate changes on cash and cash equivalents, and restricted cash |
10,924 |
40,858 |
||
|
Cash and cash equivalents, and restricted cash at the beginning of the period |
1,305,430 |
541,316 |
||
|
Cash and cash equivalents, and restricted cash at the end of the period |
703,020 |
536,810 |
||
|
Supplemental Cash Flow Information: |
||||
|
Interest paid |
(419,508) |
(397,555) |
||
|
Income taxes paid |
(125,388) |
(159,613) |
||
|
International Game Technology PLC |
||||
|
Net Debt |
||||
|
($ thousands) |
||||
|
September 30, |
December 31, |
|||
|
2018 |
2017 |
|||
|
7.500% Senior Secured Notes due July 2019 |
146,237 |
148,231 |
||
|
4.125% Senior Secured Notes due February 2020 |
504,248 |
833,655 |
||
|
5.625% Senior Secured Notes due February 2020 |
– |
595,767 |
||
|
4.750% Senior Secured Notes due March 2020 |
441,871 |
585,171 |
||
|
5.500% Senior Secured Notes due June 2020 |
125,247 |
125,709 |
||
|
6.250% Senior Secured Notes due February 2022 |
1,457,021 |
1,470,075 |
||
|
4.750% Senior Secured Notes due February 2023 |
974,884 |
1,008,601 |
||
|
5.350% Senior Secured Notes due October 2023 |
61,005 |
61,082 |
||
|
3.500% Senior Secured Notes due July 2024 |
573,132 |
– |
||
|
6.500% Senior Secured Notes due February 2025 |
1,088,008 |
1,086,913 |
||
|
6.250% Senior Secured Notes due January 2027 |
742,760 |
– |
||
|
Senior Secured Notes, long-term |
6,114,413 |
5,915,204 |
||
|
Revolving Credit Facilities due July 2021 |
147,951 |
76,880 |
||
|
Term Loan Facilities due January 2023 |
1,725,219 |
1,785,361 |
||
|
Long-term debt, less current portion |
7,987,583 |
7,777,445 |
||
|
6.625% Senior Secured Notes due February 2018 |
– |
599,114 |
||
|
Current portion of long-term debt |
– |
599,114 |
||
|
Short-term borrowings |
29,957 |
– |
||
|
Total debt |
8,017,540 |
8,376,559 |
||
|
Less: Cash and cash equivalents |
447,550 |
1,057,418 |
||
|
Net debt |
7,569,990 |
7,319,141 |
||
|
Note: Net debt is a non-GAAP financial measure |
|
International Game Technology PLC |
||||
|
Adjusted EBITDA and Free Cash Flow |
||||
|
Reconciliations of Non-GAAP Financial Measures |
||||
|
($ thousands) |
||||
|
For the three months ended |
||||
|
September 30, |
||||
|
2018 |
2017 |
|||
|
Net income (loss) |
54,008 |
(774,407) |
||
|
Provision for (benefit from) income taxes |
46,327 |
(19,824) |
||
|
Non-operating expenses |
99,693 |
238,133 |
||
|
Depreciation |
109,755 |
103,182 |
||
|
Amortization |
67,806 |
99,562 |
||
|
Service revenue amortization |
53,837 |
54,279 |
||
|
Stock-based compensation expense |
7,825 |
1,829 |
||
|
Restructuring expense |
2,768 |
9,976 |
||
|
Impairment loss |
1,530 |
715,220 |
||
|
Transaction expense, net |
6 |
627 |
||
|
Non-cash purchase accounting (excluding D&A) |
(233) |
(126) |
||
|
Bad debt expense |
– |
4 |
||
|
Adjusted EBITDA |
443,322 |
428,455 |
||
|
Cash flows from operating activities |
129,162 |
73,013 |
||
|
Capital expenditures |
(115,346) |
(181,579) |
||
|
Free Cash Flow |
13,816 |
(108,566) |
||
|
International Game Technology PLC |
||||
|
Adjusted EBITDA and Free Cash Flow |
||||
|
Reconciliations of Non-GAAP Financial Measures |
||||
|
($ thousands) |
||||
|
For the nine months ended |
||||
|
September 30, |
||||
|
2018 |
2017 |
|||
|
Net income (loss) |
184,703 |
(1,053,435) |
||
|
Provision for income taxes |
159,064 |
53,932 |
||
|
Non-operating expenses |
262,333 |
754,498 |
||
|
Depreciation |
312,203 |
289,088 |
||
|
Amortization |
204,256 |
317,989 |
||
|
Service revenue amortization |
164,952 |
155,318 |
||
|
Stock-based compensation expense |
24,944 |
5,102 |
||
|
Restructuring expense |
7,924 |
30,706 |
||
|
Impairment loss |
1,530 |
715,220 |
||
|
Transaction expense (income), net |
50 |
(26,682) |
||
|
Non-cash purchase accounting (excluding D&A) |
(666) |
(513) |
||
|
Bad debt recovery |
– |
(17,858) |
||
|
Adjusted EBITDA |
1,321,293 |
1,223,365 |
||
|
Cash flows from operating activities |
249,312 |
396,937 |
||
|
Capital expenditures |
(374,313) |
(552,169) |
||
|
Free Cash Flow |
(125,001) |
(155,232) |
||
|
International Game Technology PLC |
||||||
|
ASC 606 – Revenue Recognition Impact |
||||||
|
Condensed Consolidated Statements of Operations |
||||||
|
($ thousands, except per share data) |
||||||
|
Unaudited |
||||||
|
Q3 2018 |
||||||
|
Under Prior |
Revenue |
As Adjusted |
||||
|
Revenue |
1,177,375 |
(21,545) |
1,155,830 |
|||
|
Operating expenses |
(988,995) |
33,193 |
(955,802) |
|||
|
Provision for income taxes |
(46,006) |
(321) |
(46,327) |
|||
|
Net income attributable to IGT PLC |
10,972 |
11,327 |
22,299 |
|||
|
Net income attributable to IGT PLC per common share – basic |
0.05 |
0.06 |
0.11 |
|||
|
Net income attributable to IGT PLC per common share – diluted |
0.05 |
0.06 |
0.11 |
|||
|
Q3 2018 YTD |
||||||
|
Under Prior |
Revenue |
As Adjusted |
||||
|
Revenue |
3,619,952 |
(54,828) |
3,565,124 |
|||
|
Operating expenses |
(3,020,100) |
61,076 |
(2,959,024) |
|||
|
Provision for income taxes |
(159,342) |
278 |
(159,064) |
|||
|
Net income attributable to IGT PLC |
74,123 |
6,526 |
80,649 |
|||
|
Net income attributable to IGT PLC per common share – basic |
0.37 |
0.03 |
0.40 |
|||
|
Net income attributable to IGT PLC per common share – diluted |
0.36 |
0.03 |
0.39 |
|||
|
International Game Technology PLC |
||||||||||||
|
Condensed Consolidated Statement of Operations |
||||||||||||
|
Reconciliation of Non-GAAP Financial Measures |
||||||||||||
|
($ and shares in thousands, except per share data) |
||||||||||||
|
Quarter to date |
Adjustments |
Quarter to date |
||||||||||
|
September 2018 |
Impairment/ |
Transaction |
September 2018 |
|||||||||
|
As |
Purchase |
Foreign |
Restructuring |
and Refinancing |
As |
|||||||
|
Reported |
Accounting |
Exchange |
Expense |
Expense, net |
Adjusted |
|||||||
|
Total revenue |
1,155,830 |
(181) |
– |
– |
– |
1,155,649 |
||||||
|
Cost of services |
586,811 |
(21,241) |
– |
– |
– |
565,570 |
||||||
|
Cost of product sales |
107,311 |
(3,954) |
– |
– |
– |
103,357 |
||||||
|
Selling, general and administrative |
194,099 |
(27,017) |
– |
– |
– |
167,082 |
||||||
|
Research and development |
63,277 |
(232) |
– |
– |
– |
63,045 |
||||||
|
Restructuring expense |
2,768 |
– |
– |
(2,768) |
– |
– |
||||||
|
Impairment loss |
1,530 |
– |
– |
(1,530) |
– |
– |
||||||
|
Transaction expense, net |
6 |
– |
– |
– |
(6) |
– |
||||||
|
Total operating expenses |
955,802 |
(52,444) |
– |
(4,298) |
(6) |
899,054 |
||||||
|
Operating income |
200,028 |
52,263 |
– |
4,298 |
6 |
256,595 |
||||||
|
Interest expense, net |
(103,553) |
524 |
– |
– |
– |
(103,029) |
||||||
|
Foreign exchange gain, net |
21,104 |
– |
(21,104) |
– |
– |
– |
||||||
|
Other (expense) income, net |
(17,244) |
– |
– |
– |
19,875 |
2,631 |
||||||
|
Total non-operating expenses |
(99,693) |
524 |
(21,104) |
– |
19,875 |
(100,398) |
||||||
|
Income before provision for income taxes |
100,335 |
52,787 |
(21,104) |
4,298 |
19,881 |
156,197 |
||||||
|
Provision for income taxes (a) |
46,327 |
12,846 |
301 |
688 |
2 |
60,164 |
||||||
|
Net income |
54,008 |
39,941 |
(21,405) |
3,610 |
19,879 |
96,033 |
||||||
|
Less: Net income attributable to non-controlling interests |
31,709 |
27 |
– |
– |
– |
31,736 |
||||||
|
Net income attributable to IGT PLC |
22,299 |
39,914 |
(21,405) |
3,610 |
19,879 |
64,297 |
||||||
|
Net income per common share – diluted |
0.11 |
0.31 |
||||||||||
|
Weighted-average shares – diluted |
204,344 |
204,344 |
||||||||||
|
(a) Adjustments for income taxes are determined based on the statutory tax rate in effect in the respective jurisdiction where the adjustment originated. |
|
International Game Technology PLC |
||||||||||||
|
Condensed Consolidated Statement of Operations |
||||||||||||
|
Reconciliation of Non-GAAP Financial Measures |
||||||||||||
|
($ and shares in thousands, except per share data) |
||||||||||||
|
Year to date |
Adjustments |
Year to date |
||||||||||
|
September 2018 |
Impairment/ |
Transaction |
September 2018 |
|||||||||
|
As |
Purchase |
Foreign |
Restructuring |
and Refinancing |
As |
|||||||
|
Reported |
Accounting |
Exchange |
Expense |
Expense, net |
Adjusted |
|||||||
|
Total revenue |
3,565,124 |
(540) |
– |
– |
– |
3,564,584 |
||||||
|
Cost of services |
1,812,553 |
(63,457) |
– |
– |
– |
1,749,096 |
||||||
|
Cost of product sales |
333,065 |
(11,735) |
– |
– |
– |
321,330 |
||||||
|
Selling, general and administrative |
605,405 |
(80,602) |
– |
– |
– |
524,803 |
||||||
|
Research and development |
198,497 |
(686) |
– |
– |
– |
197,811 |
||||||
|
Restructuring expense |
7,924 |
– |
– |
(7,924) |
– |
– |
||||||
|
Impairment loss |
1,530 |
– |
– |
(1,530) |
– |
– |
||||||
|
Transaction expense, net |
50 |
– |
– |
– |
(50) |
– |
||||||
|
Total operating expenses |
2,959,024 |
(156,480) |
– |
(9,454) |
(50) |
2,793,040 |
||||||
|
Operating income |
606,100 |
155,940 |
– |
9,454 |
50 |
771,544 |
||||||
|
Interest expense, net |
(313,721) |
1,536 |
– |
– |
– |
(312,185) |
||||||
|
Foreign exchange gain, net |
96,955 |
– |
(96,955) |
– |
– |
– |
||||||
|
Other (expense) income, net |
(45,567) |
(2,184) |
– |
– |
49,459 |
1,708 |
||||||
|
Total non-operating expenses |
(262,333) |
(648) |
(96,955) |
– |
49,459 |
(310,477) |
||||||
|
Income before provision for income taxes |
343,767 |
155,292 |
(96,955) |
9,454 |
49,509 |
461,067 |
||||||
|
Provision for income taxes (a) |
159,064 |
37,101 |
6,630 |
1,829 |
2 |
204,626 |
||||||
|
Net income |
184,703 |
118,191 |
(103,585) |
7,625 |
49,507 |
256,441 |
||||||
|
Less: Net income attributable to non-controlling interests |
104,054 |
77 |
– |
– |
– |
104,131 |
||||||
|
Net income attributable to IGT PLC |
80,649 |
118,114 |
(103,585) |
7,625 |
49,507 |
152,310 |
||||||
|
Net income per common share – diluted |
0.39 |
0.75 |
||||||||||
|
Weighted-average shares – diluted |
204,375 |
204,375 |
||||||||||
|
(a) Adjustments for income taxes are determined based on the statutory tax rate in effect in the respective jurisdiction where the adjustment originated. |
|
International Game Technology PLC |
||||||||||||
|
Condensed Consolidated Statement of Operations |
||||||||||||
|
Reconciliation of Non-GAAP Financial Measures |
||||||||||||
|
($ and shares in thousands, except per share data) |
||||||||||||
|
Quarter to date |
Adjustments |
Quarter to date |
||||||||||
|
September 2017 |
Impairment/ |
Transaction |
September 2017 |
|||||||||
|
As |
Purchase |
Foreign |
Restructuring |
and Refinancing |
As |
|||||||
|
Reported |
Accounting |
Exchange |
Expense |
Expense, net |
Adjusted |
|||||||
|
Total revenue |
1,221,201 |
(182) |
– |
– |
– |
1,221,019 |
||||||
|
Cost of services |
625,247 |
(36,918) |
– |
– |
– |
588,329 |
||||||
|
Cost of product sales |
150,358 |
(23,961) |
– |
– |
– |
126,397 |
||||||
|
Selling, general and administrative |
196,862 |
(27,180) |
– |
– |
– |
169,682 |
||||||
|
Research and development |
79,009 |
(15) |
– |
– |
– |
78,994 |
||||||
|
Restructuring expense |
9,976 |
– |
– |
(9,976) |
– |
– |
||||||
|
Impairment loss |
715,220 |
– |
– |
(715,220) |
– |
– |
||||||
|
Transaction expense, net |
627 |
– |
– |
– |
(627) |
– |
||||||
|
Total operating expenses |
1,777,299 |
(88,074) |
– |
(725,196) |
(627) |
963,402 |
||||||
|
Operating (loss) income |
(556,098) |
87,892 |
– |
725,196 |
627 |
257,617 |
||||||
|
Foreign exchange loss, net |
(117,526) |
– |
117,526 |
– |
– |
– |
||||||
|
Other expense, net |
(9,802) |
(84) |
– |
– |
9,703 |
(183) |
||||||
|
Interest expense, net |
(110,805) |
610 |
– |
– |
– |
(110,195) |
||||||
|
Total non-operating expenses |
(238,133) |
526 |
117,526 |
– |
9,703 |
(110,378) |
||||||
|
(Loss) income before (benefit from) provision for income taxes |
(794,231) |
88,418 |
117,526 |
725,196 |
10,330 |
147,239 |
||||||
|
(Benefit from) provision for income taxes (a) |
(19,824) |
30,834 |
26,056 |
2,998 |
(3,230) |
36,834 |
||||||
|
Net (loss) income |
(774,407) |
57,584 |
91,470 |
722,198 |
13,560 |
110,405 |
||||||
|
Less: Net income attributable to non-controlling interests |
29,207 |
26 |
– |
– |
– |
29,233 |
||||||
|
Net (loss) income attributable to IGT PLC |
(803,614) |
57,558 |
91,470 |
722,198 |
13,560 |
81,172 |
||||||
|
Net (loss) income per common share – diluted |
(3.95) |
0.40 |
||||||||||
|
Weighted-average shares – diluted (b) |
203,489 |
203,689 |
||||||||||
|
(a) Adjustments for income taxes are determined based on the statutory tax rate in effect in the respective jurisdiction where the adjustment originated. |
|
(b) Weighted-average shares – diluted, as adjusted, include shares that were excluded from the as reported computation, due to the net loss as reported. |
|
International Game Technology PLC |
||||||||||||
|
Condensed Consolidated Statement of Operations |
||||||||||||
|
Reconciliation of Non-GAAP Financial Measures |
||||||||||||
|
($ and shares in thousands, except per share data) |
||||||||||||
|
Year to date |
Adjustments |
Year to date |
||||||||||
|
September 2017 |
Impairment/ |
Transaction |
September 2017 |
|||||||||
|
As |
Purchase |
Foreign |
Restructuring |
and Refinancing |
As |
|||||||
|
Reported |
Accounting |
Exchange |
Expense |
Expense, net |
Adjusted |
|||||||
|
Total revenue |
3,593,289 |
(540) |
– |
– |
– |
3,592,749 |
||||||
|
Cost of services |
1,866,281 |
(117,658) |
– |
– |
– |
1,748,623 |
||||||
|
Cost of product sales |
403,056 |
(77,261) |
– |
– |
– |
325,795 |
||||||
|
Selling, general and administrative |
607,571 |
(90,277) |
– |
– |
– |
517,294 |
||||||
|
Research and development |
242,142 |
(426) |
– |
– |
– |
241,716 |
||||||
|
Restructuring expense |
30,706 |
– |
– |
(30,706) |
– |
– |
||||||
|
Impairment loss |
715,220 |
– |
– |
(715,220) |
– |
– |
||||||
|
Transaction expense, net |
(26,682) |
– |
– |
– |
26,682 |
– |
||||||
|
Total operating expenses |
3,838,294 |
(285,622) |
– |
(745,926) |
26,682 |
2,833,428 |
||||||
|
Operating (loss) income |
(245,005) |
285,082 |
– |
745,926 |
(26,682) |
759,321 |
||||||
|
Interest expense, net |
(336,502) |
2,415 |
– |
– |
– |
(334,087) |
||||||
|
Foreign exchange loss, net |
(384,749) |
– |
384,749 |
– |
– |
– |
||||||
|
Other (expense) income, net |
(33,247) |
1,567 |
– |
– |
35,428 |
3,748 |
||||||
|
Total non-operating expenses |
(754,498) |
3,982 |
384,749 |
– |
35,428 |
(330,339) |
||||||
|
(Loss) income before provision for income taxes |
(999,503) |
289,064 |
384,749 |
745,926 |
8,746 |
428,982 |
||||||
|
Provision for income taxes (a) |
53,932 |
101,066 |
87,152 |
9,132 |
(88,159) |
163,123 |
||||||
|
Net (loss) income |
(1,053,435) |
187,998 |
297,597 |
736,794 |
96,905 |
265,859 |
||||||
|
Less: Net income attributable to non-controlling interests |
94,870 |
77 |
– |
– |
– |
94,947 |
||||||
|
Net (loss) income attributable to IGT PLC |
(1,148,305) |
187,921 |
297,597 |
736,794 |
96,905 |
170,912 |
||||||
|
Net (loss) income per common share – diluted |
(5.66) |
0.84 |
||||||||||
|
Weighted-average shares – diluted (b) |
203,002 |
203,303 |
||||||||||
|
(a) Adjustments for income taxes are determined based on the statutory tax rate in effect in the respective jurisdiction where the adjustment originated. |
|
(b) Weighted-average shares – diluted, as adjusted, include shares that were excluded from the as reported computation, due to the net loss as reported. |
|
INTERNATIONAL GAME TECHNOLOGY PLC |
|||||||||||
|
Select Financial Data |
Constant |
Key Performance Indicators |
% |
||||||||
|
Period Ended September 30 |
Q3 ’18 |
Q3 ’17 |
FX |
Period Ended September 30 |
Q3 ’18 |
Q3 ’17 |
Change |
||||
|
Gaming |
Total Revenue |
541 |
611 |
-10% |
Installed base (end of period) |
||||||
|
Gaming Services |
397 |
443 |
-9% |
Casino |
35,689 |
35,946 |
-0.7% |
||||
|
Terminal |
303 |
319 |
-4% |
VLT – Government Sponsored (ex-Italy) |
18,640 |
16,794 |
11.0% |
||||
|
Social (DDI) |
0 |
0 |
0% |
VLT – Italy Supplier (B2B) |
8,094 |
8,752 |
-7.5% |
||||
|
Other |
94 |
124 |
-23% |
Total installed base |
62,423 |
61,492 |
1.5% |
||||
|
Product Sales |
144 |
168 |
-13% |
Yield |
$27.84 |
$29.12 |
-4.4% |
||||
|
Terminal |
101 |
89 |
16% |
(average revenue per unit per day) |
|||||||
|
Other |
43 |
79 |
-45% |
||||||||
|
Additional Italian Network Details: |
|||||||||||
|
Lottery |
Total Revenue |
527 |
521 |
2% |
VLT – Operator (B2C) |
11,027 |
10,958 |
0.6% |
|||
|
Lottery Services |
479 |
487 |
-1% |
AWP |
43,074 |
59,084 |
-27.1% |
||||
|
FM/Concessions |
452 |
452 |
1% |
||||||||
|
LMA |
25 |
34 |
-25% |
Machine units shipped |
|||||||
|
Other Services |
2 |
1 |
-17% |
New/Expansion |
1,372 |
905 |
51.6% |
||||
|
Product Sales |
48 |
34 |
42% |
Replacement |
5,679 |
5,501 |
3.2% |
||||
|
Terminal |
0 |
1 |
-60% |
Total machines shipped |
7,051 |
6,406 |
10.1% |
||||
|
Systems/Other |
48 |
34 |
44% |
||||||||
|
Global lottery same-store revenue growth |
|||||||||||
|
Other |
Total Revenue |
88 |
89 |
0% |
Instants & draw games |
4.5% |
|||||
|
Service Revenue |
88 |
84 |
6% |
Multistate Jackpots |
-23.1% |
||||||
|
Product Sales |
0 |
6 |
-92% |
Total lottery same-store revenue growth (ex-Italy) |
0.4% |
||||||
|
Italy lottery revenue growth |
3.6% |
||||||||||
|
Consolidated |
Revenue |
1,156 |
1,221 |
-4% |
|||||||
|
Operating Income: |
|||||||||||
|
Segment Total |
306 |
305 |
1% |
||||||||
|
Purchase Accounting |
(52) |
(802) |
93% |
||||||||
|
Corporate Support |
(54) |
(59) |
8% |
||||||||
|
Total |
200 |
(556) |
NM |
||||||||
Source: International Game Technology PLC
Source: Latest News on European Gaming Media Network

Latest News
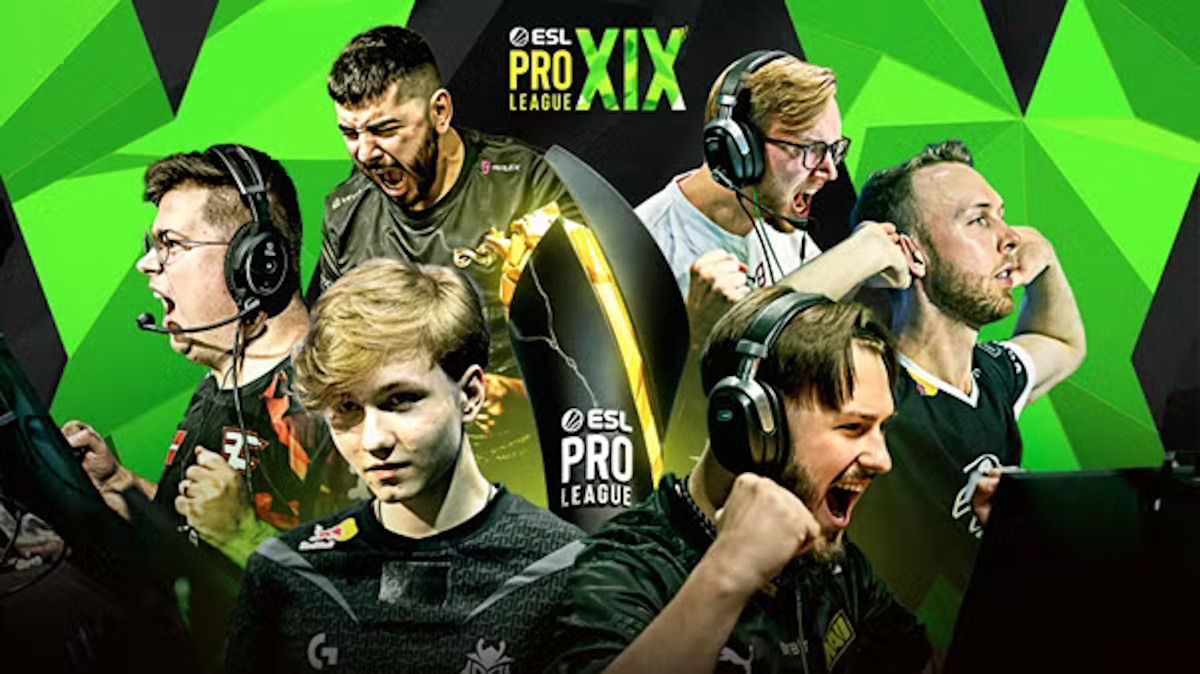
Everything you need to know ahead of ESL Pro League Season 19
The ESL Pro League (EPL) returns to St. Julian’s, Malta, for Season 19 on April 23 – May 12, 2024. The world’s biggest Counter-Strike league will see teams from around the world arrive on-site for three weeks of non-stop action, and only one team will emerge victorious as Champions.
Here is all you need to know about ESL Pro League Season 19
The 19th Season of the ESL Pro League will see the 32 best Counter-Strike teams compete for a total prize pool of $750,000, a win in the race to secure Intel® Grand Slam V, and a spot at IEM Cologne 2024. Commencing on April 23, contenders from around the globe will face off in Malta for a spot in the Playoffs. There, the six best teams will compete live in front of an intimate live audience at the InterContinental Malta on May 10 – 12, 2024.
Starting with the upcoming season, EPL will see some improvements to its schedule. While the number of teams and the tournament structure remain the same compared to recent seasons, the duration of the tournament has been adjusted to three weeks instead of five. To accommodate this change, two groups will be played simultaneously during the Group Stage, resulting in a more intense story for fans to follow.
Schedule and Format
Group Stage (April 23 – May 5):
- Four groups of eight teams will compete in separate triple-elimination brackets
- All matches are best-of-three
- The top four teams from each group will advance to the Playoffs
- Group Stage winners advance to the Quarterfinals
- The Group Stage runner-ups advance to the Round of 12
- The Group Stage third and fourth-place teams advance to the Round of 16
Playoffs (May 7 – 12):
- The top sixteen teams will compete in a single-elimination bracket
- All matches will be best-of-three, excluding the Grand Final which will be best-of-five
- The third and fourth Quarterfinals, as well as both Semifinals and the Grand Final will be played out live on stage in front of an audience
Teams Attending
- Astralis (Partner Team)
- BIG (Partner Team)
- Complexity (Partner Team)
- ENCE (Partner Team)
- FaZe Clan (Partner Team)
- Fnatic (Partner Team)
- FURIA (Partner Team)
- G2 Esports (Partner Team)
- HEROIC (Partner Team)
- MOUZ (Partner Team)
- Natus Vincere (Partner Team)
- Ninjas in Pyjamas (Partner Team)
- Team Liquid (Partner Team)
- Team Vitality (Partner Team)
- Monte (ESL Challenger Jönköping winner)
- Virtus.pro (ESL Challenger Atlanta winner)
- SAW (ESL World Ranking)
- Team Falcons (ESL World Ranking)
- GamerLegion (ESL World Ranking)
- BetBoom Team (ESL World Ranking)
- Eternal Fire (ESL World Ranking)
- 3DMAX (ECL S46 Europe winner)
- FORZE (ECL S46 Europe runner-up)
- M80 (ECL S46 North America winner)
- BOSS (ECL S46 North America runner-up)
- The MongolZ (ECL S46 Asia-Pacific winner)
- TYLOO (ECL S46 Asia-Pacific runner-up)
- Imperial Esports (South American Qualifier winners)
- Sharks Esports (South American Qualifier winners)
- Pera Esports (European Conference winner)
- Bad News Kangaroos (Oceanic Qualifier winner)
- FlyQuest (ANZ Champs winner)
Prize Money (USD)
| TOTAL | $750,000 |
| 1st | $170,000 |
| 2nd | $80,000 |
| 3rd-4th | $45,000 |
| 5th-8th | $32,000 |
| 9th-12th | $23,500 |
| 13th-16th | $17,500 |
| 17th-20th | $12,000 |
| 21st-28th | $7,000 |
| 29th-32nd | $3,500 |
Broadcast Talent
- Hosts
- “Tres “stunna” Saranthus
- Freya “Freya” Spiers
- A Stream
- Jason “moses” O’Toole
- Janko “YNk” Paunović
- Mathieu “Maniac” Quiquerez
- Harry “Harry” Russell
- Hugo “Hugo” Byron
- Henry “Henry” Greer
- Chad “SPUNJ” Burchill
- Alex “Machine” Richardson
- B Stream
- Neo “Ne0kai” Caine
- Harvey “Skriv” Rodgers
- Lucy “LucyLuce” Eastwood
- Brandon “BDog” Rawlings
- Travis “Trav” Landaw Mott
Where to Watch
The live broadcast will be available on FACEIT Watch, ESL FACEIT Group’s premier esports viewing platform created by esports fans for esports fans and open for all.
Featuring a unique multi-perspective view selector where users can watch their favorite player’s perspective directly next to the main event stream, a live chat, a kill cam, live-generated replays of key moments, a sound mixer, a rewards program, and more, FACEIT Watch revolutionises esports streaming by putting fans in control of their viewing experience.
Fans can also watch the action on the ESL Counter-Strike Twitch and YouTube channels. For those unable to tune in live, all matches will also be available to watch on-demand for free via YouTube.
For more information about ESL Pro League Season 19, and the latest updates on the event, please visit the official website, and follow ESL Counter-Strike on X, Facebook, and Instagram.
The post Everything you need to know ahead of ESL Pro League Season 19 appeared first on European Gaming Industry News.
Latest News
New Market Alert! Hacksaw Gaming Touch Down in Portugal with Solverde.pt
Another incredible new market launch for Hacksaw Gaming, this time we’re taking a trip to Portugal with Solverde.pt. Exclusively showcasing our content until the 30th of April, this new partnership looks to be one with an exciting journey ahead.
Fan favourites Wanted Dead or a Wild, 2 Wild 2 Die, R.I.P City, Le Bandit and many more are now featured on the Hacksaw exclusive section of the Solverde.pt platform. At long last, Portuguese players can now immerse themselves in the Hacksaw experience, exploring a large catalogue of our games that demonstrate our creative mechanics and stunning visuals.
“Hacksaw has been a top request from Portuguese casino players and we always aim to know the market preferences and deliver what the customers want” says Américo Loureiro, Solverde.pt Director “We’re very proud to bring this groundbreaking studio to Portugal for the first time and have no doubt it will be a success”
Part of Solverde Group, which boasts more than 50 years of history, Solverde.pt was launched in 2017.
They strive to offer the widest casino portfolio in Portugal, prioritising all the fun of casino games with the top quality and safety that SolverdePT users have come to know them for.
Marcus Cordes, Hacksaw Gaming CEO is certain that Hacksaw enthusiasts in Portugal will be ecstatic with this new launch – “Being able to bring yet another growing market our games is what drives us forward! Saúde to a promising future partnership and to the teams who made this happen.”
With this latest launch marking our third new market entry in the past month alone, Hacksaw Gaming’s quest to introduce our collection to players worldwide is rapidly becoming reality. Are we setting the tone for even more groundbreaking ventures in the months ahead? Stay tuned, as we’re on a mission to grow our Hacksaw Community far and wide.
The post New Market Alert! Hacksaw Gaming Touch Down in Portugal with Solverde.pt appeared first on European Gaming Industry News.
Latest News
Week 16/2024 slot games releases
Here are this weeks latest slots releases compiled by European Gaming
Habanero, is introducing the Reel Rewards feature in its new 6×3 reel slot Golden Taj Mahal. Paying homage to Indian culture, the game sees tigers, candles, precious gemstones, the prince and princess as well as the magic lamp Wild fill the grid as the slot’s symbols. At the top of the board, there are six empty spots which can be filled by the Reel Rewards mechanic on any spin, awarding a prize ranging from 2x, 3x or 5x multipliers to a Wild, which transforms all symbols below it.
After releasing the frenzy of a slot game that was Brick Snake 2000, the award-winning slot provider is now set to release Tombstone No Mercy an upgraded refresh of its 2019 hit slot, Tombstone. The 2024 refresh stays true to the original game and introduces Nolimit Bonus Buys and Nolimit Booster into the mix. With the introduction of Nolimit Bonus Buys, players can buy right into the bonus rounds; Justice Spins, Gunslinger
Games Global exclusive studio PearFiction Studios has unveiled its latest release, Cerberus Gold, incorporating three engaging LockNWin bonuses that can be combined for great win potential. This mythological title boasts an exciting triple collection mechanic that sees each collection pot protected by a head of the fearsome guardian of the underworld, Cerberus, who precariously sits above the reel set.
4ThePlayer in collaboration with Yggdrasil is unveiling its new release, 4K Ultra Gold MoneyWays, through the YGG Masters platform. This game evolves 4ThePlayer’s popular MoneyWays mechanic as seen in the top-performing 4 Fantastic series where cash on the reels is won by forming ways wins without the need for additional symbols or features. In 4K Ultra Gold, every cash symbol is boosted when it lands on the reels, creating additional excitement and anticipation.
Push Gaming has released the second in its series of DJ games, DJ Cat, which brings a range of new features to amp up engagement. Following the success of DJ Fox, this new follow-up retains the easy-to-understand, win-what-you-see gameplay, adding in larger win multipliers. Lining up CD symbols helps players to build big prizes while VIP icons grant access to spin the decks and feed the Multiplier Meter. Arrow symbols crank the volume and unlock more reels using the iconic Push-Up feature.
Inspired Entertainment is thrilled to announce its latest slot game, Spin 2 Riches™, now available the UK B3/LBO market. Offering players an unparalleled gaming experience filled with mystery symbols and Fortune Spins. Spin 2 Riches invites players to embark on a thrilling adventure where every spin brings the promise of untold riches.
PG Soft, a world-class digital mobile games company, is on target again with its latest fun-filled game release, Piñata Wins. Set against a vibrant fiesta backdrop, Piñata Wins is a five-reel and three-row title offering players a colourful gaming experience with plenty of features with an opportunity to make big returns from multipliers up to x100. The reels are brought to life with symbols that celebrate Mexican culture including tacos, maracas, skulls, sombreros and chillies.
Endorphina, has announced the release of its latest slot game, Moon Tiger, on April 17th. Featuring 5 reels, 3 rows, 25 fixed paylines, and cool bonuses, the slot will soon join Endorphina’s portfolio of over 150 games. Inspired by Chinese mythology, this slot embodies the legendary White Tiger, a creature born from a rare occurrence in the heavens.
Blueprint Gaming is inviting players to live like royalty and reign over Phrygia in its latest scatter-pay release, the Greek mythology-themed Midas King of Gold. Players attempt to turn every touch into gold in this 6×5 scatter pays title, with the King himself appearing in symbols on the game’s richly coloured board alongside royal pillars and ancient artifacts.
Playson, the fast-growing digital entertainment supplier, has combined the striking themes of its most successful games in its latest title Energy Joker: Hold and Win. With coins, electricity and a grinning joker, this fast-paced release has lightning running through its reels. The blue Collect feature strikes the cells and gathers all values, including the Mini, Minor and Major jackpots and Bonus symbols.
Spinomenal has released its new hit, Queen of the Amazon. Set amongst the lush rainforest, this 5×4 slot welcomes players on an adventure where treasure awaits intrepid explorers. A majestic Amazon headdress, tiger, gorilla, and snake, make up the Medium symbols on the reels. At the heart of the story stands the queen herself, representing the Wild symbol.
Embark on a thrilling journey across continents in 80 Day Escapade, the dramatic new slot from Boldplay that offers multiple features for endless excitement and rewards. With its 5×3 reels and 243 ways to win, players will enjoy a world of adventure and fortune but the real excitement begins with the set of exciting bonus features.
The post Week 16/2024 slot games releases appeared first on European Gaming Industry News.
-

 Latest News2 months ago
Fairplay Exchange signs as new sponsor of Stephen Hendry’s Cue Tips
-

 Latest News2 months ago
2 PEOPLE CAUGHT OPERATING ILLEGAL ONLINE GAMING SITE
-

 Latest News2 months ago
Wazdan partners with 711.nl for significant expansion in the Netherlands
-
Latest News3 months ago
The Gold Standard in Affiliate Programs: How Partners 1xBet Dominates the iGaming Market
-

 Latest News2 months ago
Playtech Extends Partnership with BoyleSports Until 2028
-

 Latest News3 months ago
How Kiosk Terminals are Revolutionising the Sports Betting Experience
-

 Latest News3 months ago
OneCasino Partners with Delasport to Also Conquer Sports Betting in the Netherlands
-

 Latest News2 months ago
StarGames Named Premium Partner of the International ADAC Truck Grand Prix 2024




















You must be logged in to post a comment Login